The obsession with numbers and trends is not just something unique to mobile apps. Every field has its share of analysts that pour over many sets of data to devise trends and figure out a way to exploit them.
The difference when it comes to mobile apps is the nascent stage of the industry as a whole. It has only been twelve years since the app market really took off with the launch of the iPhone.
A new industry such as mobile apps is bound to have a number of crests and troughs in its early years. This makes its analysis all the more important and challenging.
A data warning – When the numbers can be misleading
In 1968, Stanford professor Dr. Paul Ehrlich released a book called The Population Bomb. The book essentially predicted mass worldwide famines during the 70s and 80s. Dr. Ehrlich made this prediction based on the increasing rate of population and the lower growth rate of agricultural output.
The book became very popular at the time and fed into the idea of population explosion.
However, we all now know that Dr. Ehrlich was wrong. There were no worldwide famines in the 70s and 80s. Dr Ehrlich’s models didn’t account for the unpredictability of human innovation and a range of other factors. Even now in the twenty-first century, we don’t have widespread famines when the world population is over seven billion.
What does this lesson in history tell us? Numbers and trends can tell us about a deep and underlying problem. However, using numbers to predict the future is a slippery road.
Even when speaking of mobile app usage and marketing, it is important to approach stats and trends with an open mind. Drawing drastic conclusions from a given set of data is often counterproductive. Data generally points to trends, not conclusions. Trends can change and backtrack, conclusions can’t.
Before we delve into the fifty most interesting facts about mobile app usage and statistics, it is important to keep this simple lesson in mind. If you’re about the process to make app online or build one using code, going through the following stats will give you fresh insights on the app market.
General app market stats – How big is the world of mobile apps?
1. Global app downloads across Android and iOS devices in Q2 2020 was 37.8B. This is the highest number of downloads recorded on the Google Play Store and Apple App Store. The number fell to 36.4B in Q3 2020 (Sensor Tower)
2. Tik Tok was the most downloaded app in Q3 2020 on both the Google Play Store and Apple App Store (Sensor Tower)
3. Daily time spent on mobile devices in India was 4.8 hours. In the United States, the average daily time was 3 hours. (App Annie)
4. On average, users have 40 mobile apps on their devices. They spend 89% of their mobile sessions on 18 apps only. (Simform)
5. Google and Facebook are the top app companies in the world. Chinese giant ByteDance comes in at third followed by AliBaba and Microsoft (Source: App Annie)
6. India ranks first in average time spent on non-gaming apps amongst countries like Brazil, USA, Indonesia, Japan, France, UK and so on. (App Annie)
7. Time spent on mobile devices increased most in developing countries during the COVID lockdown period. Smartphone use grew by 82% in China and 78% in India. This is a stark contrast to 43% growth in the US and 46% in the UK (Global Web Index)
8. Google Play Store offers Android users the option to choose from 2.87M apps. The Apple App Store offers over 1.96M apps to iOS users. (Statista)
9. Windows Store is the third biggest app store behind the Google Play Store and the Apple App Store. It offers users over 669K mobile apps. Other app stores behind Windows include the Amazon Appstore and Blackberry World. (Statista)
10. Tinder and Netflix lead the mobile app market for overall consumer spending (App Annie)
11. Excluding China, India was the largest market for mobile apps with roughly 7 billion downloads. (Sensor Tower)
Some important app usage statistics – How are people using mobile apps?
12. 91% of users access mobile apps at home. 83% of users use mobile apps in the washroom. 73% of users open apps during dinner and only 62% access them while commuting. (Simform)
13. An average user uses nine apps everyday and over thirty over the period of a month. (TechJury)
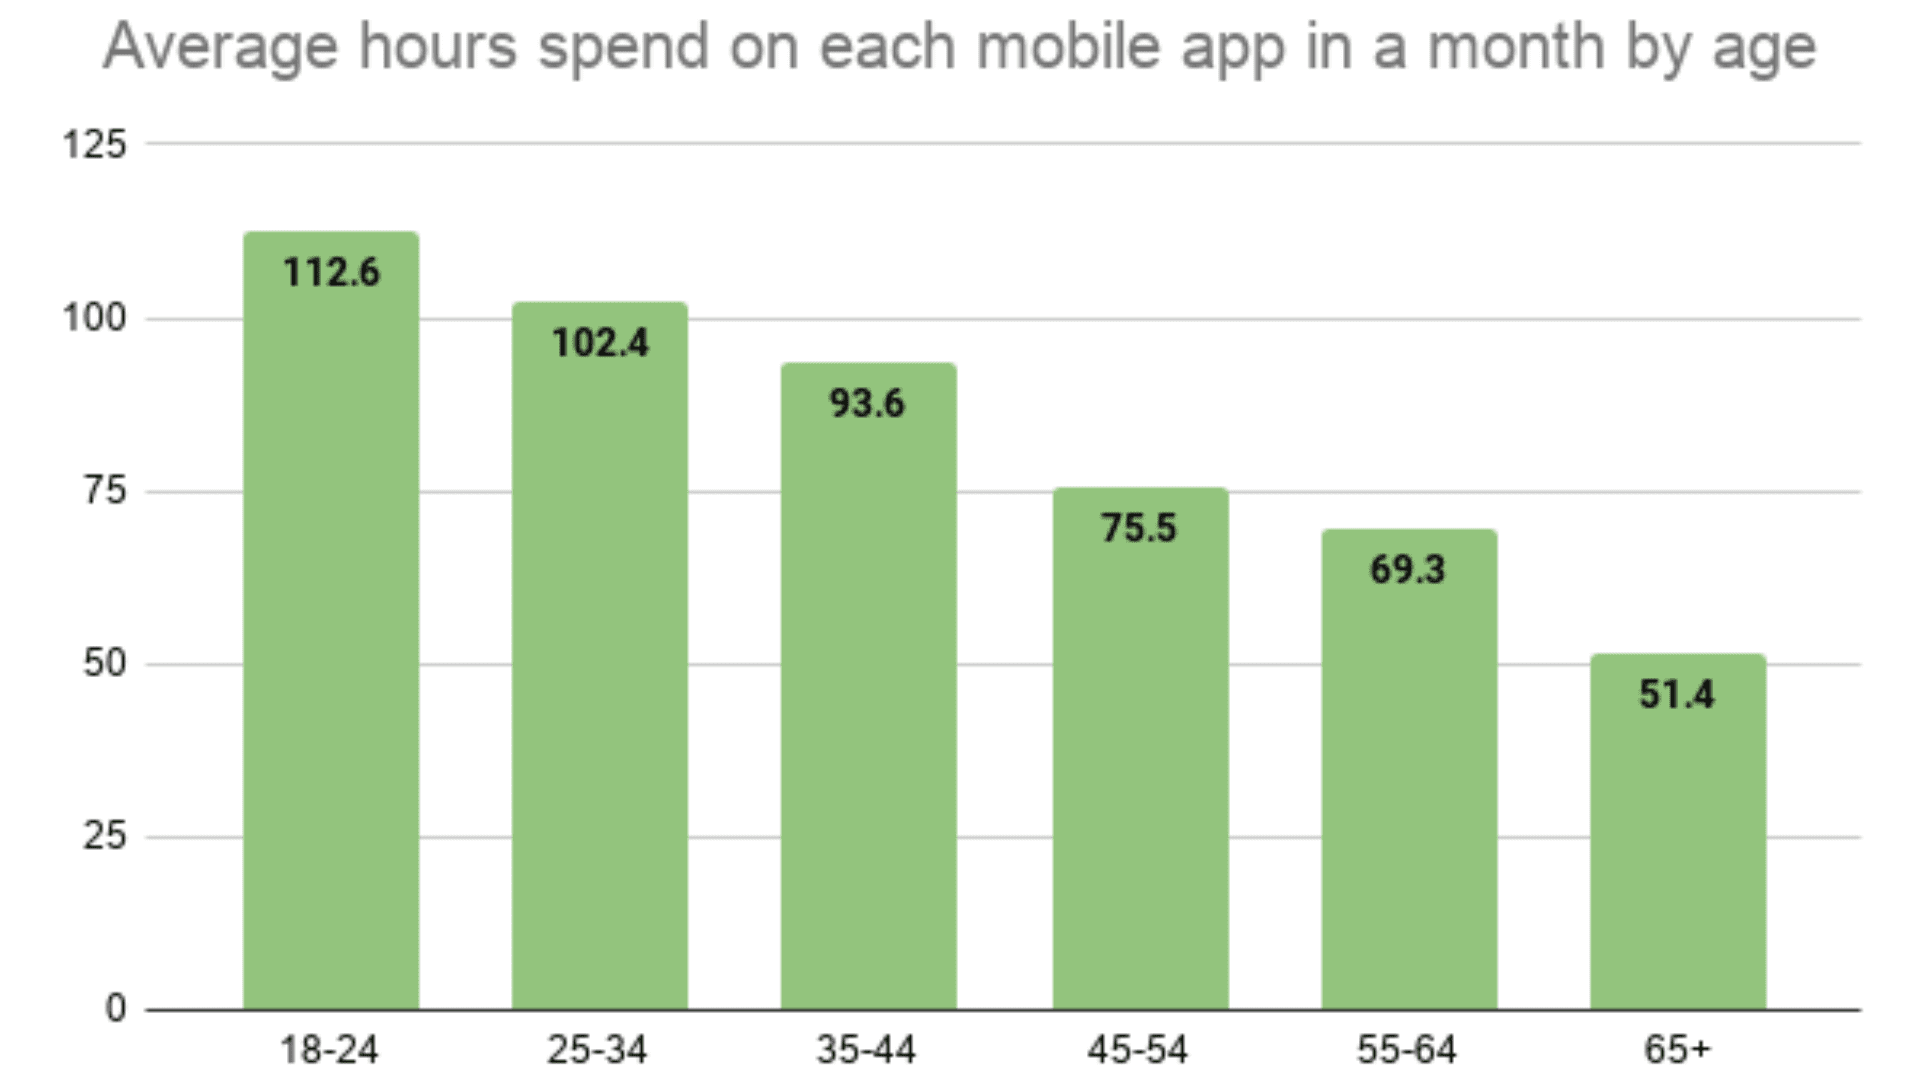
14. Users between ages 18-24 spend the most time on mobile apps. The following chart shows app usage by hours per week for users in different age groups. (Simform)
15. Young app users (Gen Z) spend 3.8 hours each month on the top 25 non-gaming apps. These hours translate to roughly 150 app sessions per month. This highlights the high attention app users provide to the apps that really matter and have a large audience. (App Annie)
16. 90% of users download mobile apps to watch online videos. Streaming music is a close second at 72%. (Global Web Index)
Category-based app usage statistics – Which type of mobile apps are gaining steam?
17. Daily active app users for the mobile game segment went up by 30% by the end of April 2020. This number comes from a time when a lot of countries in the world were under complete lockdown due to the COVID-19 pandemic. (App Annie)
18. Mobile apps appear to be winning the battle with mobile websites when it comes to ecommerce. Only 12% shoppers find the experience offered by mobile websites as satisfactory. (Source: Dynamic Yield) E-commerce app development is thus a viable option for businesses to grow online.
19. Social media apps continue to be the most used. People spend roughly 131 minutes per week on social media apps. Gaming apps are in second at 116 minutes followed by messaging & calling apps at 102 minutes (Source: Simform)
20. 77% shoppers in the US check their smartphone to compare prices while making a purchase in a retail store. (Salsify)
21. Ed tech, health & fitness, and banking & fintech grew the most during Q2 2020. The daily active users of fitness apps grew by 24%, banking & fintech apps grew by5.96%, and ed tech apps grew by just under 23% (Moengage)
22. Travel and mobility apps fell sharply during Q2 2020. This was largely caused by the COVID-19 pandemic. Global daily active usage fell by 5.36% for travel apps and 5.55% for mobility apps. (Moengage)
23. Ecommerce app downloads fell by 1.42% in India while daily active users fell by 13.88%. (Moengage)
24. App usage for the primary education of children increased by 56% in July 2020. Streaming films came at a close second at 54%. (Global Web Index)
25. Video apps consumed the maximum volume of data during Q1 2020 66% of all app data spent was on video apps. Social media was far away in the second place at 10%. App updates were in third spending 4% of all app data (HootSuite)
26. Mobile gaming increased the most in India. The number of mobile games played in India increased by 35% compared to 2019. In second place was Russia at 30%. Increase in mobile gaming numbers is also a direct consequence of the COVID pandemic increasing the overall time spent on mobile apps. (App Annie)
27. 41% Gen Z app users use social media as a channel to pass the time. 40% also use it to find entertaining content while 34% depend on it to stay updated with the latest news. (Global Web Index)
28. Users today spend 50% of their time on social media apps. Video and entertainment apps are second at 21% of time spent while gaming apps are third at 9%. (App Annie)
29. Educational apps like Udemy and Coursera saw an enrollment increase of 640% and 400% respectively. (The Conversation)
User experience stats- How is UX affecting key app metrics?
30. 53% of users abandon an app if it takes more than three seconds to load. This again underlines the importance of app performance in retaining users and maximizing the value of each user session. (Google)
31. Mobile ads take five seconds to load on average. Mobile ad networks thus are a major contributor to slow mobile speeds. (Media Ratings Council)
32. 25% of users abandon apps after using them once. The number has risen from 21% in 2018 and again points to the rising standard of app users. (Upland Software)
33. Only 32% users access an app more than eleven times after downloading it. This shows that users might take an interest in an app they download, but expect continued engagement. (Upland Software)
34. A larger number of choices often leads to lower user satisfaction and sales. This is according to a study conducted long ago by the Harvard Business School. The study is still cited whenever there is user disengagement due to a variety of available options (Harvard Business Review)
35. A 5% increase is customer retention and leads to a direct increase in profit between 25-95%. This marks the massive need to maintain retention rate. (Harvard Business Review)
36. The average churn rate of apps across the world stands at 71% over a period of three months. User retention during the same period is thus 29%. (Statista)
37. US mobile users get around 46 notifications on an average every day. (Clever Tap).The push notification reaction rate on Android was 7% and 4.9% on iOS. (Accenage)
38. The ecommerce space lost $1.42 trillion dollar due to bad UX problems. This marks a serious need for developers to offer the best possible mobile shopping experience. (Trillion Dollar UX Problem)
39. Online orders worth $260B were abandoned by shoppers in the US due to poor checkout process. This is both alarming and a massive opportunity for ecommerce apps and websites to improve their revenue. (Trillion Dollar UX Problem)
40. The return on investment on every dollar spent on user experience is $100. (Forbes)
41. Average app session on Android devices is 6.7 minutes and 5.6 minutes for iOS devices. This average time is largely driven up by social media and gaming apps that have a very high session duration (Statista)
42. Around 78% people notice bugs and performance issues in an app. This again speaks to the massive need for a comprehensive mobile app testing strategy (Applause)
Future app usage predictions – Where is the tide headed?

43. Global smartphone users are expected to grow to 3.5B by the end of 2020. This will be a significant landmark for companies trying to take their app to a wider audience. (Statista)
44. Global app downloads are expected to reach 150B in 2020. The number is expected to grow in the coming years. For 2024, the predicted global app downloads number is slated to reach 184B. (Sensor Tower)
45. User spending on app stores is expected to increase by a factor of 92 points to $157B by 2022. (App Annie)
46. Mobile app revenue is expected to touch over $580B in 2020 with the aid of in-app purchases, advertising, and paid apps. (Statista)
47. The total mobile workforce is expected to be just shy of 1.9B by 2022. This means 42% of the global workforce will be connected through mobile devices. (IBM)
48. Use of smartphone assistants is also expected to grow as voice-services improve. The total number of voice assistant users is slated to reach 100M by 2022. (EMarketer)
In conclusion
The aforementioned sections cover a lot of numbers and trends. For someone starting out and just in the process to convert WordPress website to Android app, the numbers may come as a jolt. This is true for probably anyone starting out or even those with an app on an app store trying to make it.
The lesson here is learning.
The sections above must help readers understand their market better. Some numbers provide encouragement. The growing size of the app market is a clear example of the same.
Some numbers also invoke fear. The cutthroat nature of the ecommerce sector for instance may scare some people who just managed to turn WooCommerce to Android app.
Fear can’t be avoided. However, companies and entrepreneurs bringing an app to market must be brave enough to overcome it. If an app provides real value, it will make its own place in the market.