Generally, app development takes on a very monopolistic role in discussions about mobile apps. The overall complexity of creating an app is enough to make most companies focus on development above all else.
This often leads to companies underestimating app marketing. This is natural considering the ordeal companies have to go through in building an app. Not every company knows about the effortless app creation capabilities of a reliable online app maker. This makes them delve into custom app development and overcome its unique challenges.
This doesn’t diminish the importance of mobile app marketing by any means. The Google Play Store has a total of 2.87 million mobile apps.
Can you name 200 apps on the Play Store right off the bat?
There is a good chance you can’t. There are many apps on both the Google Play Store and the Apple App Store. However, not all of them have a cogent marketing strategy to raise awareness amongst the right people.
This marks the importance of app marketing and advertising. The following sections cover a collection of more than fifty statistics covering app marketing and advertising. These numbers will help readers get deep insights into app marketing from the perspective of businesses and normal app users.
Also read: Top 75 mobile app usage and download statistics you should know
In this blog
- General mobile and app marketing stats you should know about
- App Store Optimization numbers- Getting app downloads organically
- App advertising stats- How much are companies spending in outbound efforts?
- Social media marketing statistics – Role of social media in mobile marketing
- Future of mobile app marketing and advertising
- Mobile entertainment statistics
- Mobile video statistics
- Worldwide mobile advertising demand statistics
- Mobile website optimization statistics
- Frequently asked questions
General mobile and app marketing stats you should know about
How do companies market their apps? How do they approach general mobile marketing?Trends come and go. New channels struggle to provide real value at times while old forms of marketing continue to work better than ever before. The following app and mobile marketing statistics provide some general insights for those trying to get more mobile visibility.
1. Conversion rate for purchases on mobile phones has increased to 2.12% in Q2 of 2020. It was at 1.82% in Q2 2019. In the same period of time, conversion rate for desktops fell from 3.9% to 2,38%. This again points to the rising need for all companies selling products online to target both mobile and desktop users. (Kibo Monetate)
2. 54% marketers confirm they use mobile app platforms to promote their products and services. This represents a window of opportunity for many marketers. Apps are currently underused for marketing purposes. (Salesforce)
3. Mobile ad spending took up roughly 67% of all money spent on digital ads, clocking at over $87 billion. (eMarketer)
4. The number of ad platforms used by the top 100 apps in the US increased by 25% for iOS devices and 20% for Android devices (data.ai)
5. Total user spending on mobile apps has reached $120B. The figure is more than two times what it was in 2016, highlighting the growth in the app market. (data.ai)
6. Startups coming out with a mobile apps had a 825% higher IPO valuation compared to non-mobile startups (data.ai)
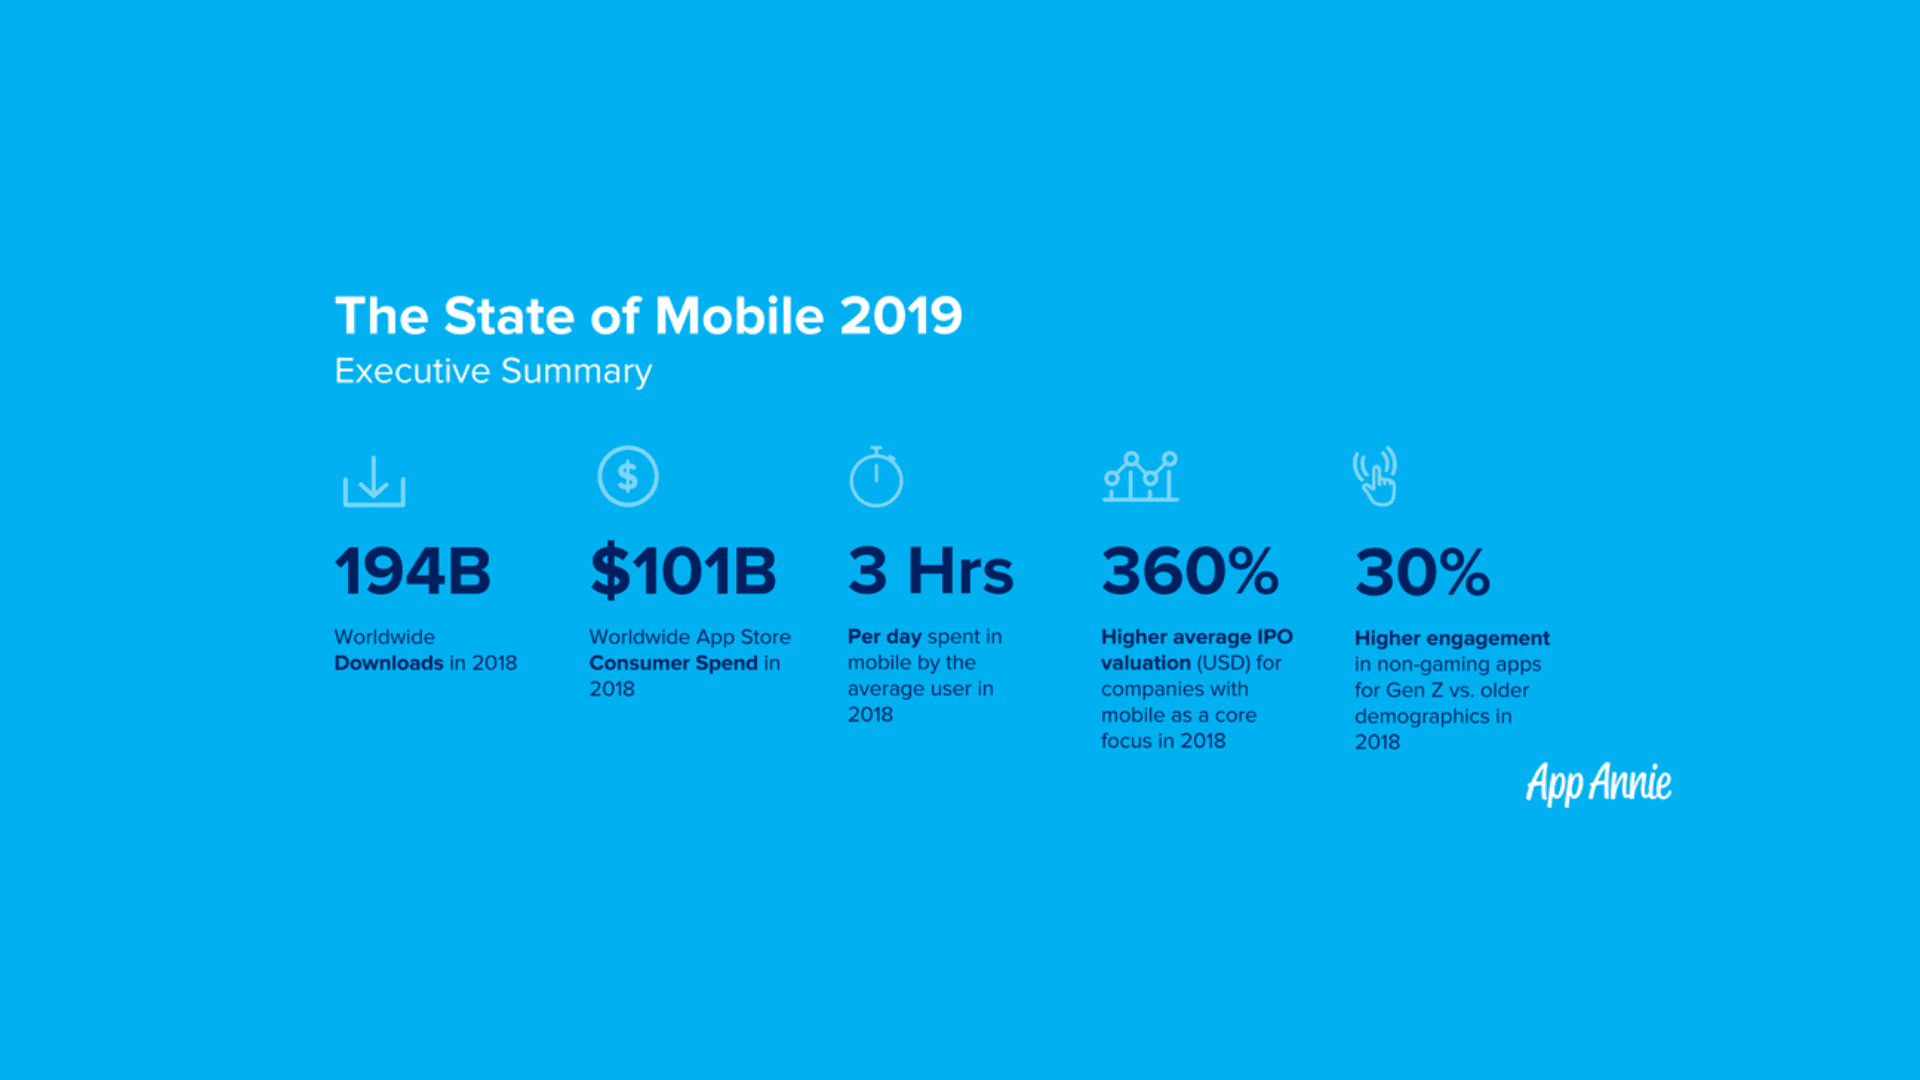
7. 96% of consumer spending for non-gaming apps came from subscription fee charges. This marks the rise of the subscription model as the primary model of app monetization. (data.ai)
8. Apps with a multi-channel engagement strategy are likely to have 62% higher retention rate compared to apps with a single channel strategy. (Lean Plum)
9. Adding emojis in push notifications can increase their click-through-rate by 85%. (Lean Plum)
10. Push notifications can increase the overall retention rate of a mobile app by as much as 20 points. Furthermore, users are four times more likely to open a notification if it contains their name. (Lean Plum)
App Store Optimization numbers- Getting app downloads organically
A lot of app marketing is generally about app store optimization. This is understandable considering the fact that it’s one of the main sources where an app can get organic downloads from. The following app store optimization statistics point to some interesting numbers for marketers interested in getting more app downloads organically.
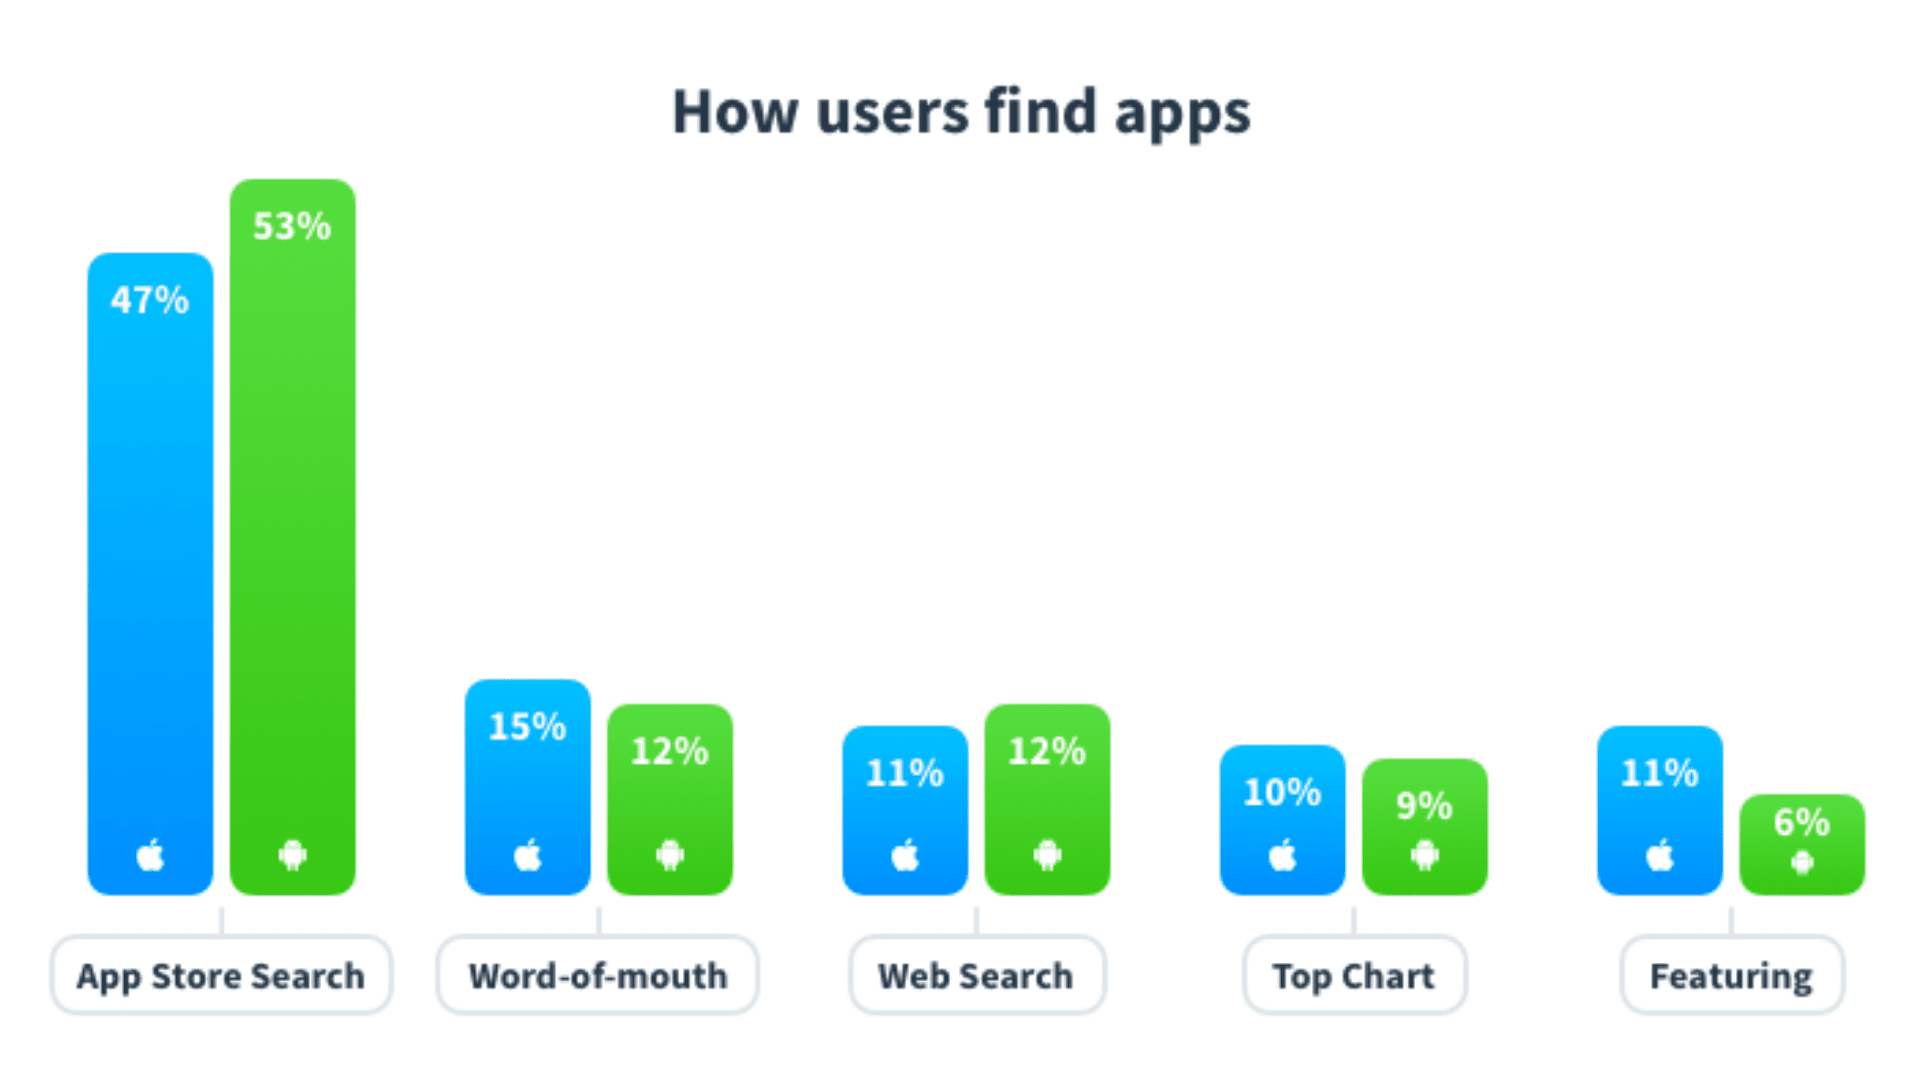
11. 65% of app downloads on the Apple App Store come from organic search. This again underlines the needs for apps to have a strong app listed filled with rich keywords. (Apple)
12. Changing the app description was the most common form of ASO update at 46%. Changing the app icon was at 30% (data.ai)
13. The most important factor in driving conversions on the Apple App Store is the collection of screenshots added. App icon comes in second while ratings come in third. (ASO Factors Expert Survey)
14. 70% of users on the Apple App Store use search to find a product. (Apple)
15. The most important factor in driving conversions on the Google Play Store is the app icon. It is followed by the screenshots added and the ratings. (ASO Factors Expert Survey)
16. More than 51% smartphone users discover a new product with mobile search. While not directly related to ASO, it points to the massive role of mobile search in discovery (HubSpot)
17. Adding a video to an app store listing can increase installs by 25%. Adding a video is thus more than about setting your app apart. It can have a direct impact on the number of app downloads you get. (Store Maven)
18. App name is the most crucial factor in the ranking of an app on both the Apple App Store and the Google Play Store (ASO Factors Expert Survey)
19. Apps using the same graphics for the Google Play Store and the Apple App Store saw iOS installs fall 20-30% (Store Maven)
20. In a survey of 45 ASO experts across the world, 69% felt app engagement will become an important ranking factor. (ASO Factors Expert Survey)
21. 26% top fifty free apps currently have a video on their Google Play Store listing. This number increases to 54% for the top fifty free apps on the Apple App Store. (Store Maven)
App advertising stats- How much are companies spending in outbound efforts?
App advertising is a very big vertical in its own right. A whole range of mobile ad networks have come up in the last few years and helped advertisers reach their target audience through native mobile apps. The following numbers provide an interesting insight into the app advertising vertical.
The value of global advertising will reach up to $280 billion by 2022 which is a 47% increase since 2019. (Statista)
In 2021, advertisers put 51% of their marketing budget into mobile advertising (Digital Examiner).
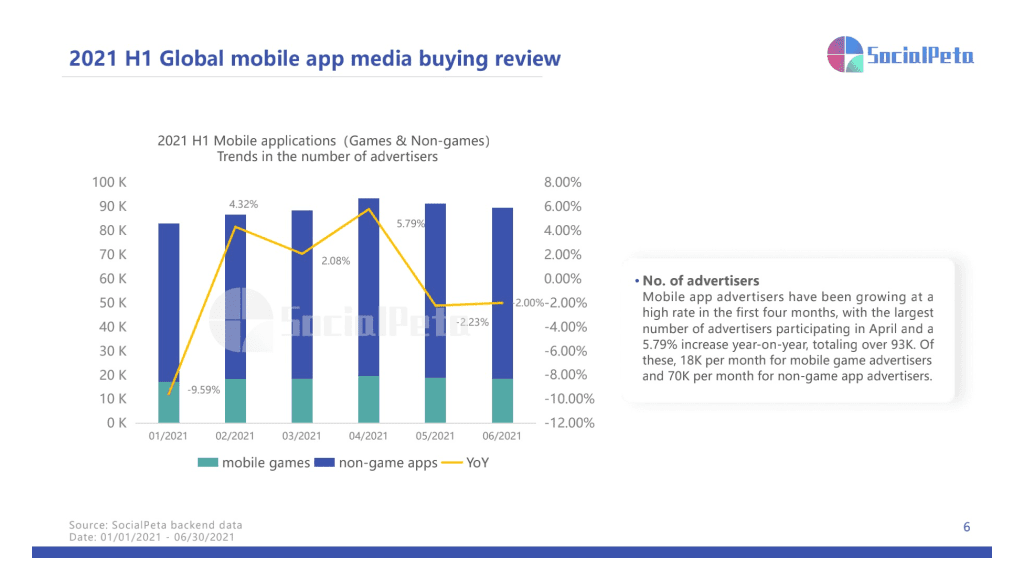
As per Social Peta’s 2021 H1 Global Mobile App Marketing Whitepaper, the number of advertisers increased in the first half of the year by 5.79% when compared with the 2020 H2. (SocialPeta)
22. 77% users in the US who use ad blocking services are prepared to view some ad formats. This provides a ray of hope to advertisers that wish to attract ad-averse users with relevant and engaging ads. (PageFair Report)
23. Paid search ads on the Apple App Store have a conversion rate of 50%. This is a very high number compared to search ads on other platforms (Apple)
24. Mobile devices using ad block services increased to 380 million devices. This clearly underlines the general aversion people have for generic advertorial content. (PageFair Report)
25. Mobile advertising spend is slated to rise 26% to $241 billion. This marks a serious rise is the overall ad spend companies are willing to allocate to mobile. (data.ai)
26. There was a net increase of 19% in money spent by companies on branding campaigns in gaming apps. Gaming apps are the hot destination for many companies looking to run branding campaigns. (data.ai)
27. Paid ad campaigns brought in 15% more gaming app downloads compared to last year. (data.ai)
28. Apps that use mobile ad networks for monetization are expected to increase by 60%. This provides a significant window of opportunity for advertisers looking to reach a mobile audience (data.ai)
29. The value of an average order on a mobile device is over $84. This number is much lower than the order value on desktop devices which clocks to roughly $122. (Kibo Monetate)
30. Mobile users tend to recall app ads 47% of the time. The number falls marginally to 46% for mobile web ads and 36% for desktop ads. (EConsultancy)
31. Video ads in mobile apps have 34% better CTR than native ads. The number rises to 56% when compared to typical banner ads (inMobi)
32. Click through rates of in-app video ads have grow by 300% (inMobi)
Social media marketing statistics – Role of social media in mobile marketing
No one can ignore social media when it comes to online marketing. Social media is a key tenet of app marketing and plays a decisive role in helping an app get downloads and build an engaging profile. The following provides interesting insights on the role of social media in mobile and app marketing.
Social networks account for greater than 12.74% of all mobile data traffic. (Digital Examiner)
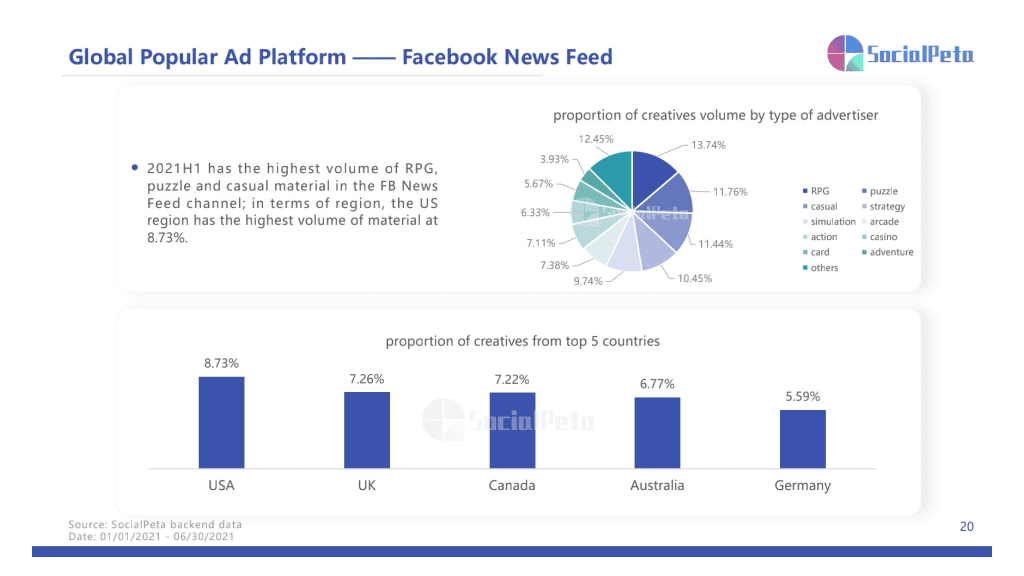
In 2021 H1, Facebook news feed accounted for nearly 20% of the creatives in the shopping app category. (SocialPeta)
33. Facebook ads containing images are likely to be at least 75% more effective than simple text ads. (Customer Acquisition)
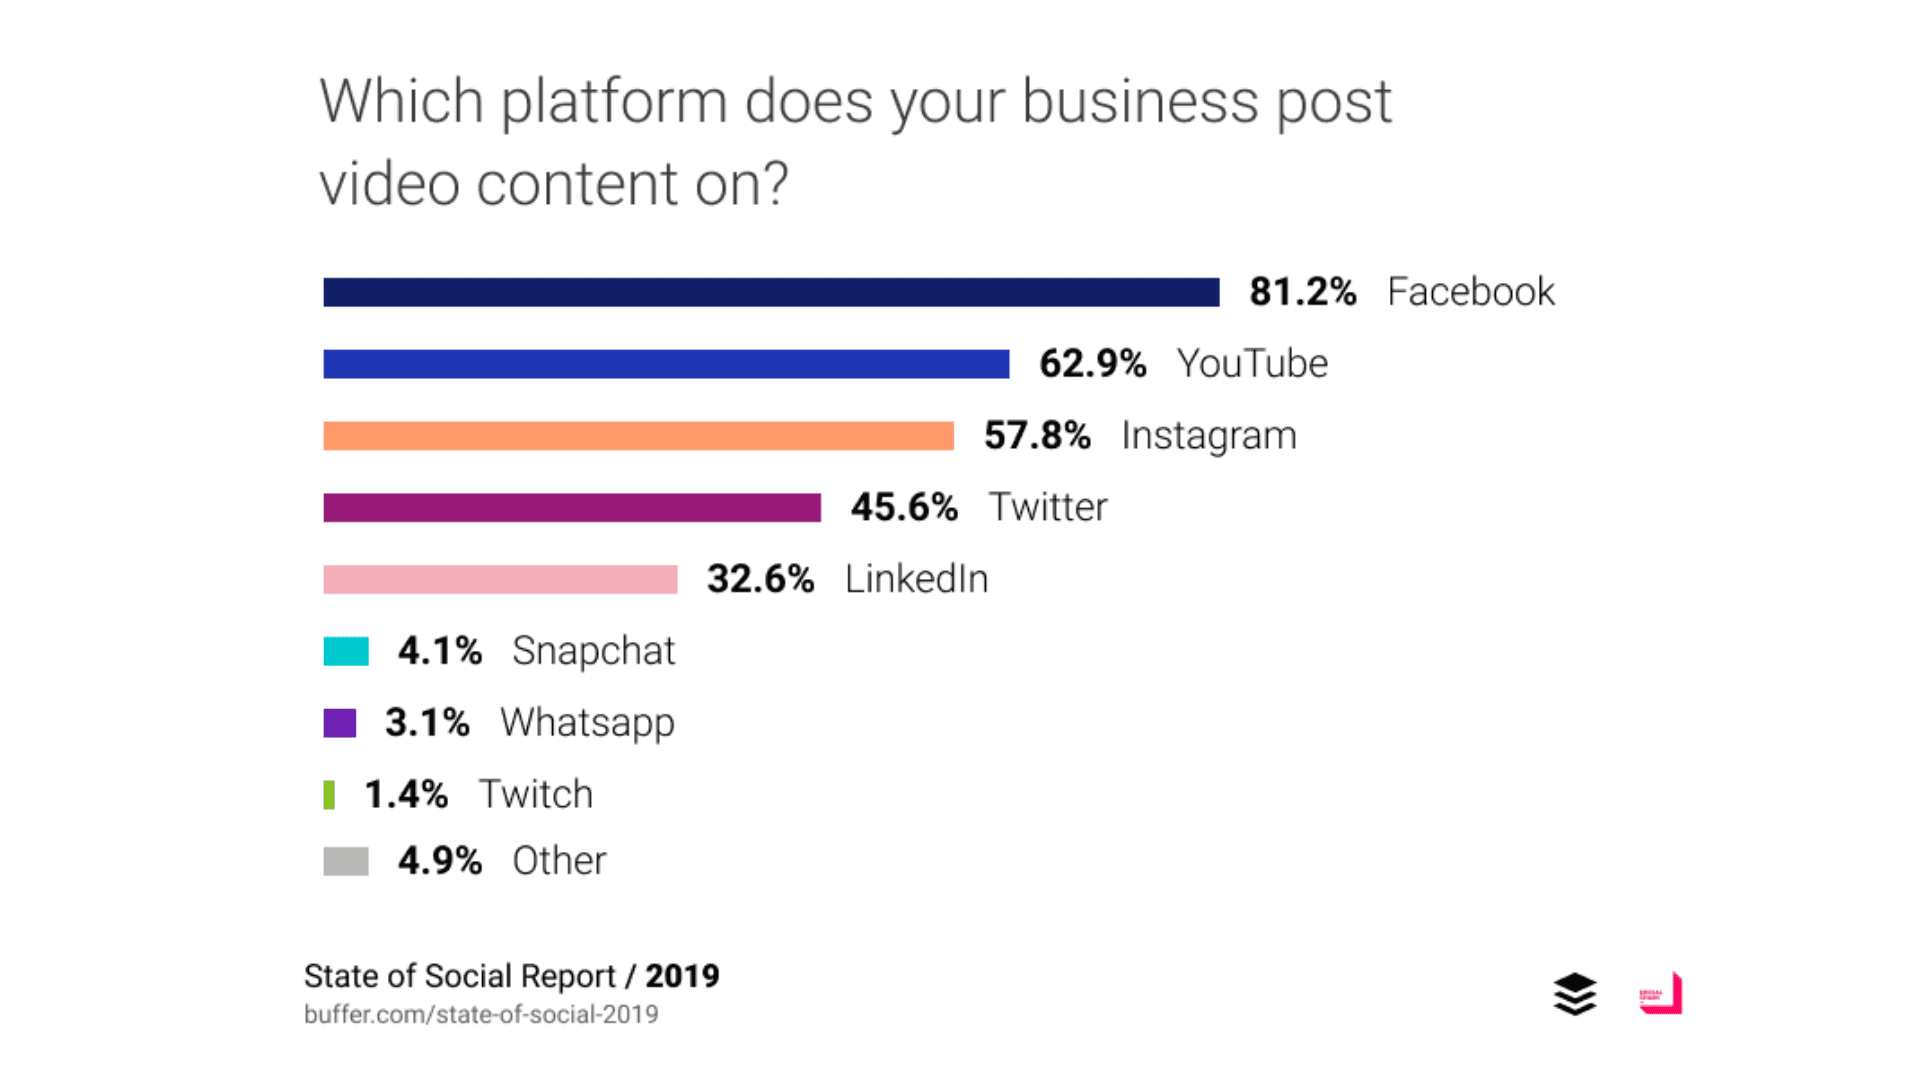
34. Over 81% businesses likely to market their brand on Facebook prefer video marketing. The rise of video as the most powerful content medium seems unstoppable (Buffer)
35. During live events, Twitter ads are known to be 11% more effective than TV ads (Twitter Business)
36. Twitter is a very effective medium for customer outreach. As many as 83% people are likely to do business with a company if they reply to a tweet they send. (Twitter Business)
37. Twitter’s monetizable DAU (daily active users) grew by 17% to 145 million. (Twitter)
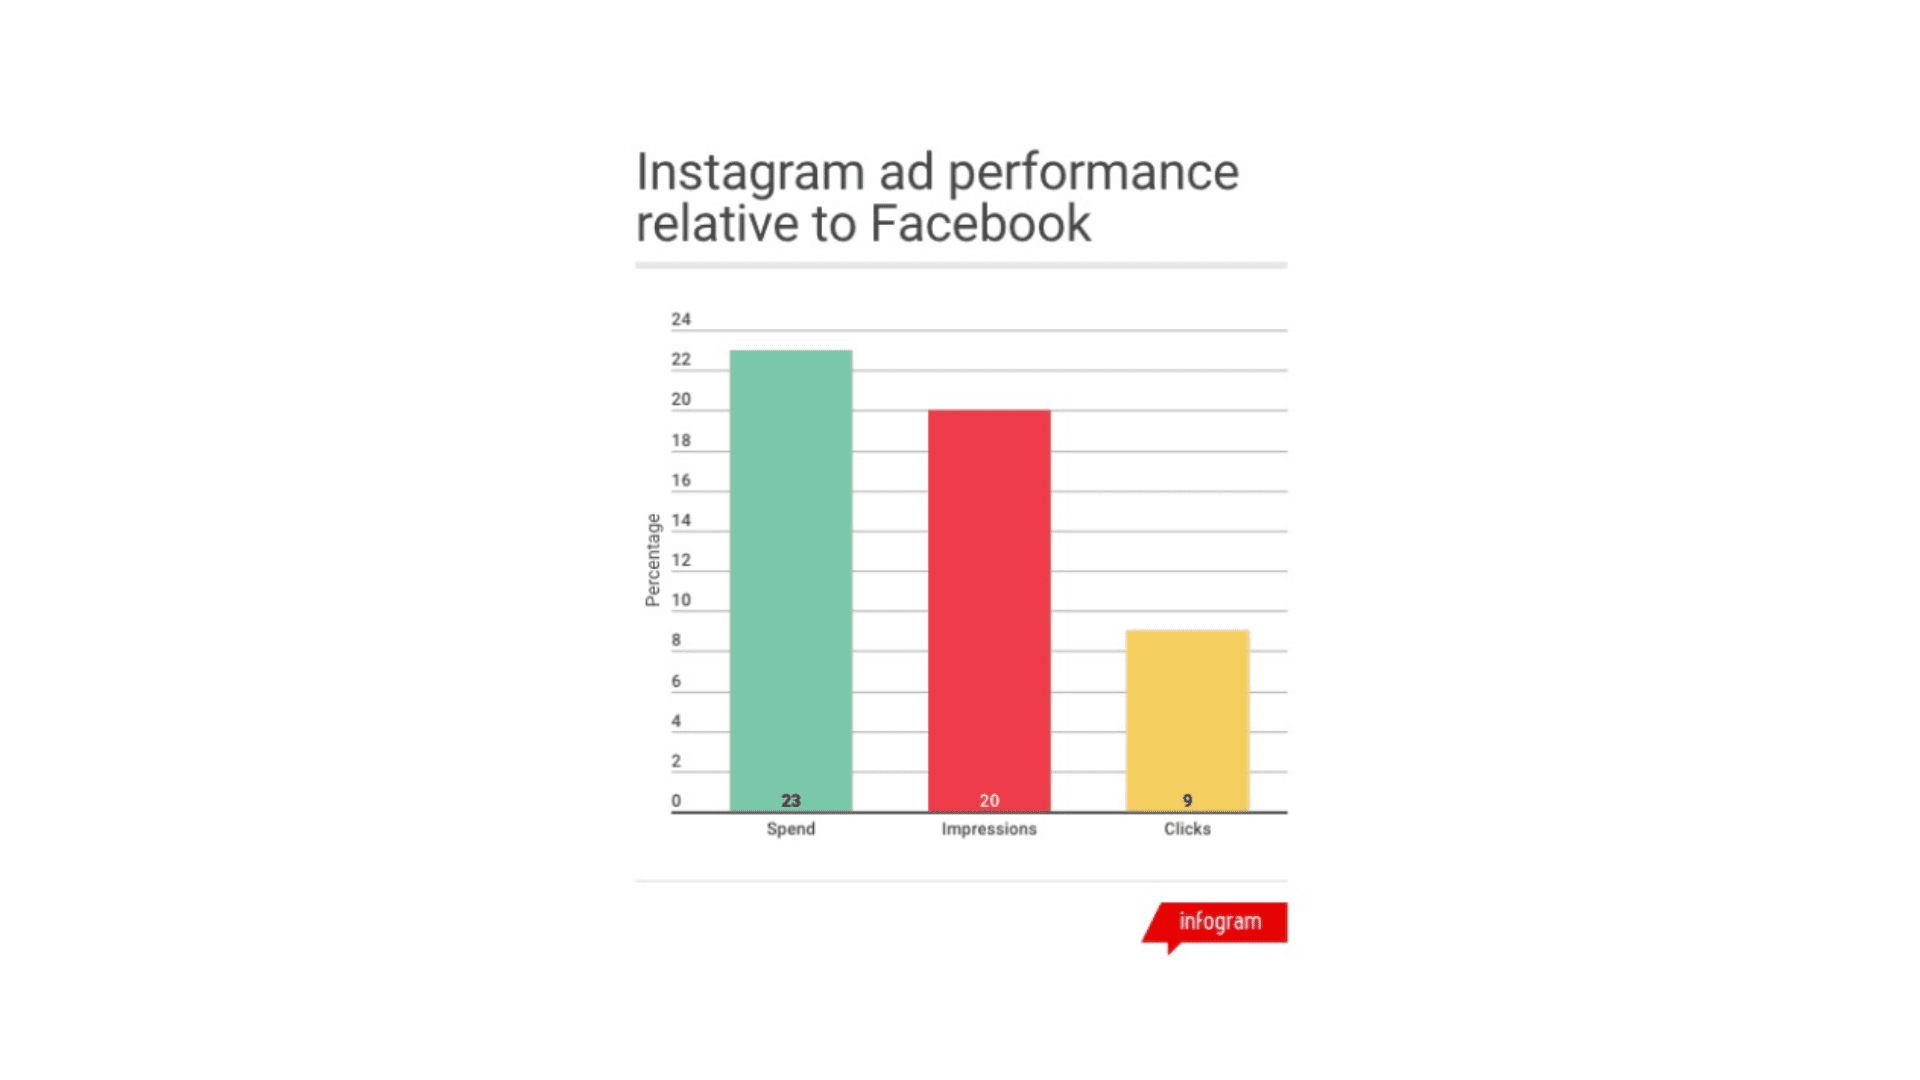
38. Instagram beats Facebook in terms of ad spending by 23%. This is partly because of the higher engagement rate of Instagram as a platform and its younger user base (DigiDay)
39. 25% of Facebook’s ad revenue came from Instagram alone. The power of Instagram in the pantheon on platforms under Facebook is made clear by this number alone (Vox)
40. More than 80% of B2B leads from social media platforms come from LinkedIn. This is naturally expected considering the overall professional tone of LinkedIn as a platform. (LinkedIn)
41. Almost half of all the social media traffic business websites get comes from LinkedIn. That is the reason why most enterprises actively use a sales navigator to find prospects on LinkedIn and send them cold emails covering business offers. This speaks to its enormous role in professional marketing LinkedIn)
Future of mobile app marketing and advertising
Everyone wants to know the future. The future of mobile app marketing is something many companies running apps are invested in. More often than not, the numbers help us see where the tide is headed. For someone building an app with code or using a free online app maker, the future of mobile app marketing holds importance for anyone in the app world. The following points provide a glimpse into how the future could unfold for mobile apps.
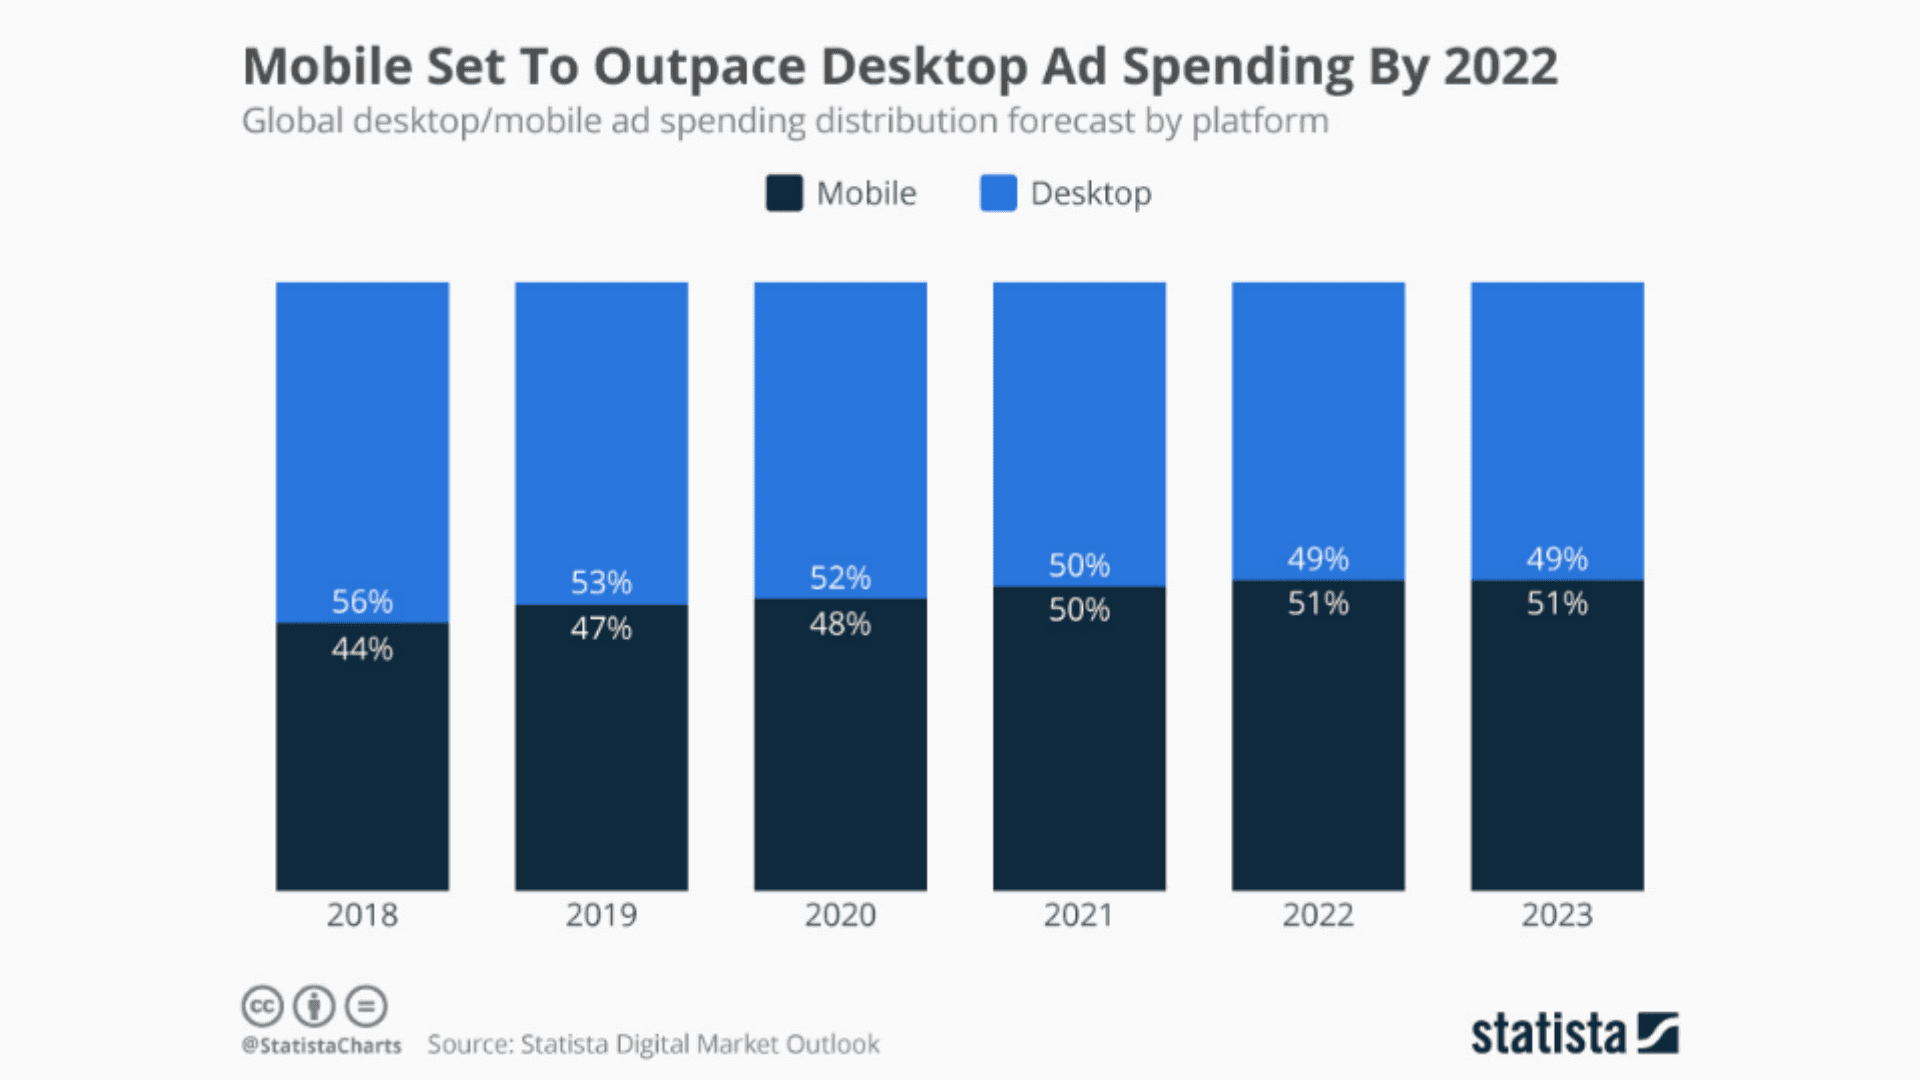
42. Mobile ad spending is slated to overtake desktop spending by 2023. This is in keeping with the growing smartphone and mobile app usage numbers. (Statista)
43. In-app advertising is expected to touch $201 billion by 2021. This signals the continued rise of mobile ad networks as a significant channel for mobile app marketing (data.ai)
44. Instagram’s share in Facebook’s total ad revenue is expected to grow to 30% by the end of 2020. (Vox)
45. Smartphone users are expected to spend over 47 minutes every day on social media apps by the end of 2021 (EMarketer)
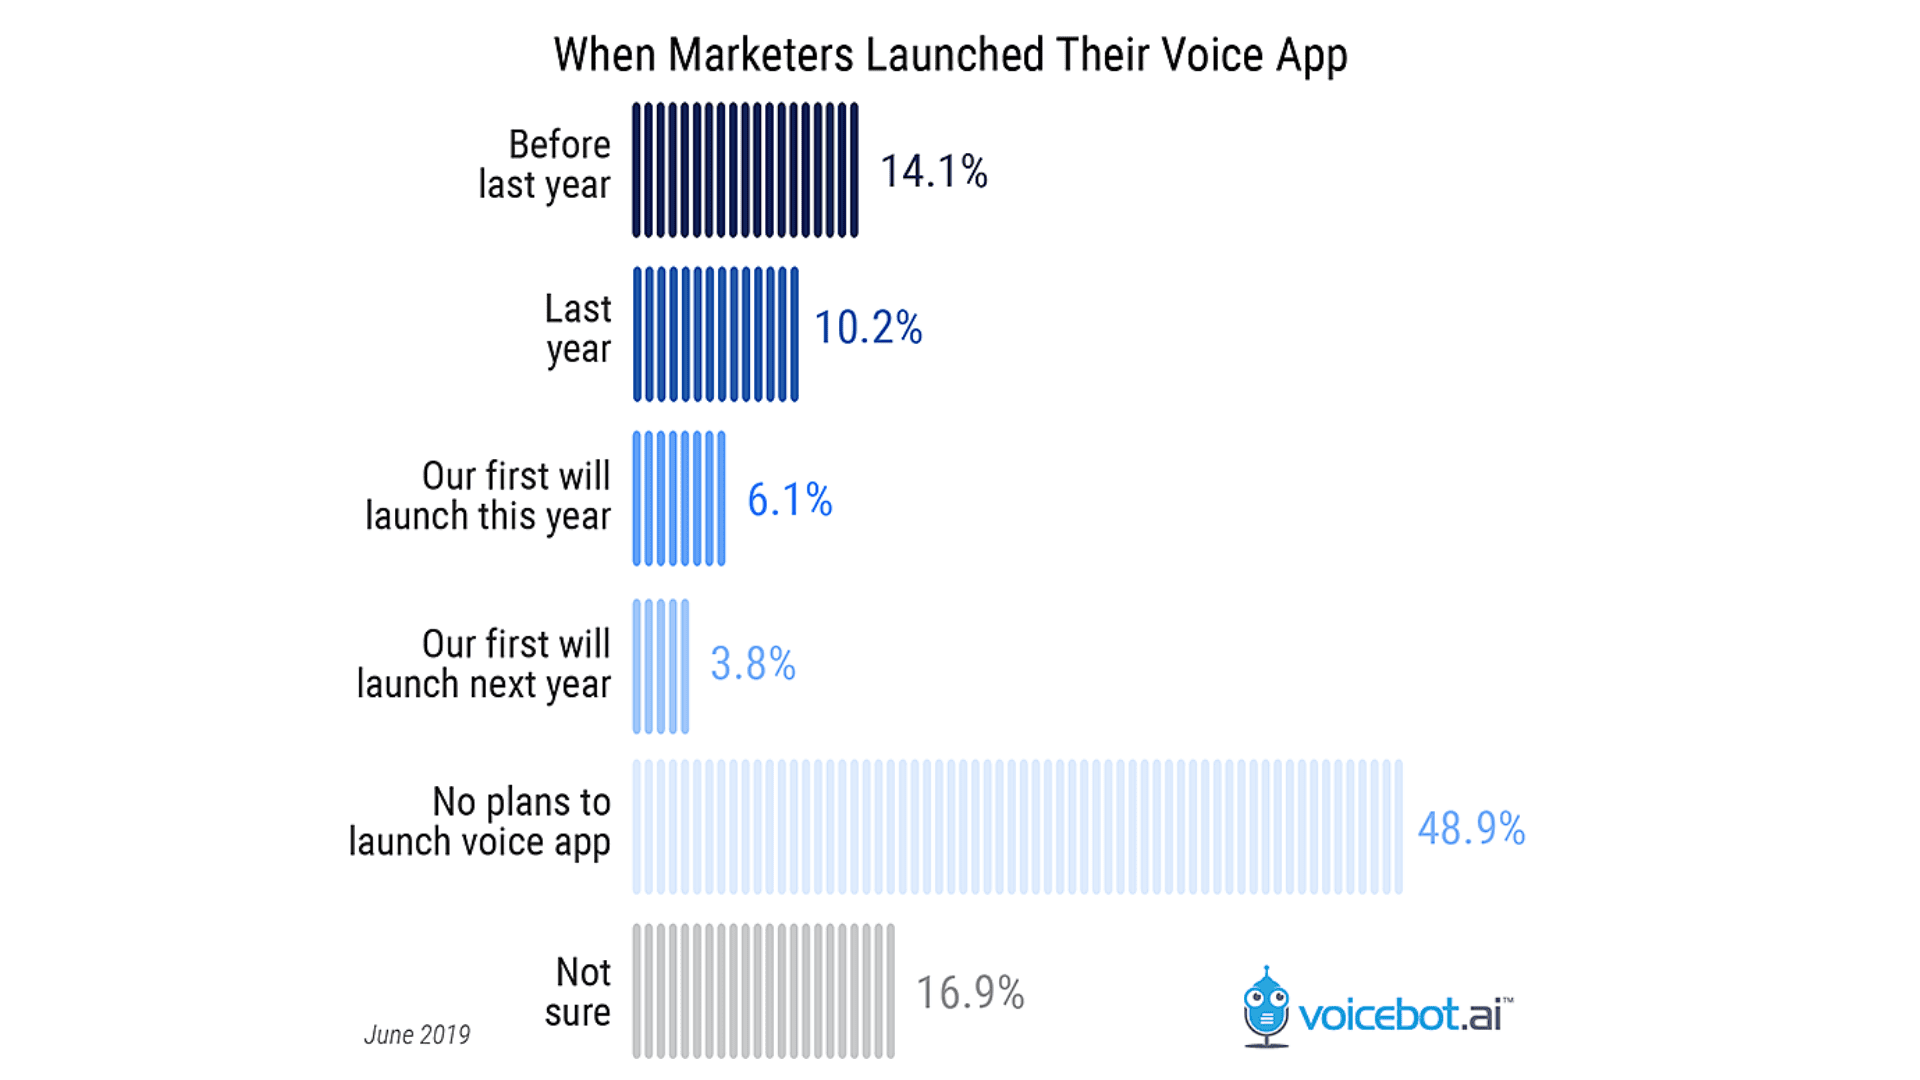
46. 34% app marketers expect to have a voice-enabled app by the end of 2020. This will mark a significant turn in how app marketing works works on a tactical level. (Voice Bot)
47. The gaming app segment is expected to grow to more than $165 billion. This will make it the largest gaming channel (data.ai)
Mobile entertainment statistics
Whether it’s gaming or streaming, your target audience is likely on mobile. Given that apps drive a majority of online internet traffic, it’s fair to say that smartphone users are ideal for mobile entertainment.
48. 16% of users watch movies, live events, and shows on mobile devices. (Semrush)
50. YouTube mobile advertising is 84% more likely to deliver results when compared to traditional TV advertising. (Think with Google)
51. Over 52% of smartphone users have a gaming app on their devices. In comparison, 95% of users have a messaging or social media app on their devices.
52. Gaming is the most popular category on Google Play and Apple App Store. (EventYa)
Mobile video statistics
Want to know how users watch videos on mobile devices? Here’s a list of insightful statistics that cover mobile video-related numbers and stats.
53. 75% of all video views come from mobile devices. (TechJury)
54. US-based users spend 323 minutes a week watching video content on mobile devices. (TechJury)
55. Mobile video ad spending is expected to grow to $9.26 billion by 2024. (TechJury)
56. Video viewing on mobile phones grows by roughly 100% annually. (Udonis)
57. Your target audience is 1.5 times more likely to watch your video ad on a smartphone (Facebook)
Mobile voice search statistics
Voice search is not a new phenomenon anymore. Most smartphone users are accustomed to the voice search feature on their devices. The following statistics provide a glimpse into mobile voice search statistics:
58. 20% of searches in the Google mobile app take place via voice search. (Think with Google)
59. Users aged between 18 and 34 use voice search the most. (Bright Local)
60. Google’s voice search feature can recognize over 119 languages. (The Verge)
61. The page load time of voice search results is faster than typical text-based search. (Backlinko)
62. 18% of smartphone users have never used voice search, and don’t plan to do so in the future. (Bright Local)
Worldwide mobile advertising demand statistics
Want to learn how mobile advertising is taking shape on different platforms? The following stats summarize key numbers related to mobile advertising:
63. Mobile advertising is expected to decrease by 10% by the end of 2022. (Semrush)
64. 94% of Facebook’s ad revenue comes from mobile ads. (TechJury)
65. Over 50% of ad clicks take place on mobile devices. (Web FX)
66. One third of all mobile ad spending goes to Google, making Google Ads one of the biggest ad platforms in the world. (Web FX)
Mobile website optimization statistics
Most website owners create mobile responsive sites now, given how much smartphone usage has grown. The following statistics explain key data points related to mobile website optimization.
67. Lack of mobile optimization can cause websites to lose 90% of their users and customers. (Quora Creative)
68. The traffic share of mobile sites has grown to 56% in 2022. (Clever Road)
69. The conversion rate of mobile apps is 3 times higher than that of mobile websites. (jMango) Thus, it is a viable option to develop shopping apps.
70. Every second of added load time lowers your mobile site’s conversion rate by 4.4% (Digital Examiner)
71. 80% of top-ranking websites are mobile-friendly. (IMPACT)
In conclusion
Statistics and data help companies make more informed business decisions. From someone coding an app from scratch to trying to convert WordPress website to Android app, making data-driven decisions is a must.
The same principle applies in app marketing as well. There are many avenues marketers go off chasing in a typical app marketing campaign. Many of these avenues don’t promise anything much in terms of value. A second glance towards some well-known facts can enable companies from avoiding such mistakes.
This piece discusses the many statistics associated with mobile app marketing and advertising. These numbers will enable readers to make more informed decisions while promoting their app. Given the high stakes involved every time an app is brought to market, knowing the numbers is a good way to start.
Frequently asked questions
Seek answers to questions regarding mobile app advertising? The following FAQs provide answers to some commonly asked questions.
How effective is in-app advertising?
In-app advertising can be an effective technique for marketing your app to your target audience. While ads are generally assumed to be interruptive, new marketing techniques have ensured that app ads can be integrated natively and without disrupting an app’s user experience. To get started with in-app advertising, you can either sign up for a mobile ad network or directly approach the app you wish to advertise on.
What percentage of ads are mobile?
60% of digital ad spend is on mobile according to Statista. In total, $327.1 billion is spent on mobile advertising. The United States is the leading country when it comes to mobile ad spending.
What percentage of app users click on ads?
According to an Insider Intelligence survey, 31% of users sometimes click on ads. Only 10% of users click on ads regularly.
Why is in-app advertising important?
In-app advertising is important as it helps advertisers reach the right audience. Apps collect user demographic information such as location, preferences, gender, and more. Advertisers can use the data to make sure their ads are targeted to the right people. Given how much app usage has grown, it can be a good idea to promote your business.