If you have a website or an e-commerce store, then you need to be future-ready by creating a mobile app. In fact, every business and organization needs an app in this world run by smartphones. It has become imperative for overall success and growth.
We strongly believe that businesses can tap a huge growth opportunity if they make quality mobile apps and market them well to mobile app users. However, many business owners are not convinced about building apps for their businesses; therefore, we decided to talk facts!
In this article, we will explore why you should not miss building an app for your website, e-store, or any other business at large. We have curated vital information about mobile apps’ market size, usage, growth, and other associated factors.
This information was collected through market research on mobile apps by the top reliable companies and organizations. Once you are convinced that it’s valuable to build an app for your business, you can create one using a WordPress or WooCommerce mobile app builder that is quick and cost-effective.
Let’s start with the app statistics that will establish the importance of building mobile apps.
In this blog
- Mobile app market: An overview
- Mobile app usage statistics
- Mobile app usage statistics by age & demography
- Mobile app vs website statistics
- Mobile app revenue statistics
- Mobile app industry trends
- Mobile app design & performance figures
- Mobile app marketing statistics
- App Store Optimization statistics
- Futuristic trends of the mobile app industry
- Miscellaneous statistics
- How to create an app in 3 easy steps
Mobile app market: An overview
The market for apps is growing at a fast pace. Here is the general overview of the market and the top reasons why businesses should lean towards building a mobile app to raise their revenue:
1. Growth of the mobile industry: There were more than 5 billion smartphone users in the year 2022 and the number is expected to cross 6 billion by 2028. Moreover, the number of smartphone mobile network subscriptions worldwide reached almost 6.4 billion in 2022. It is projected to reach 7.7 billion in 2028. (Source: Statista)
2. Mobile app market size: Total revenue in the app market was estimated at USD 475.90 billion in 2022. The revenue is forecast to experience significant growth in all segments in 2027. It is expected to show an annual growth rate (CAGR 2022-2027) of 8.58 percent resulting in a projected market volume of US 755.50 billion by 2027. (Source: Statista)
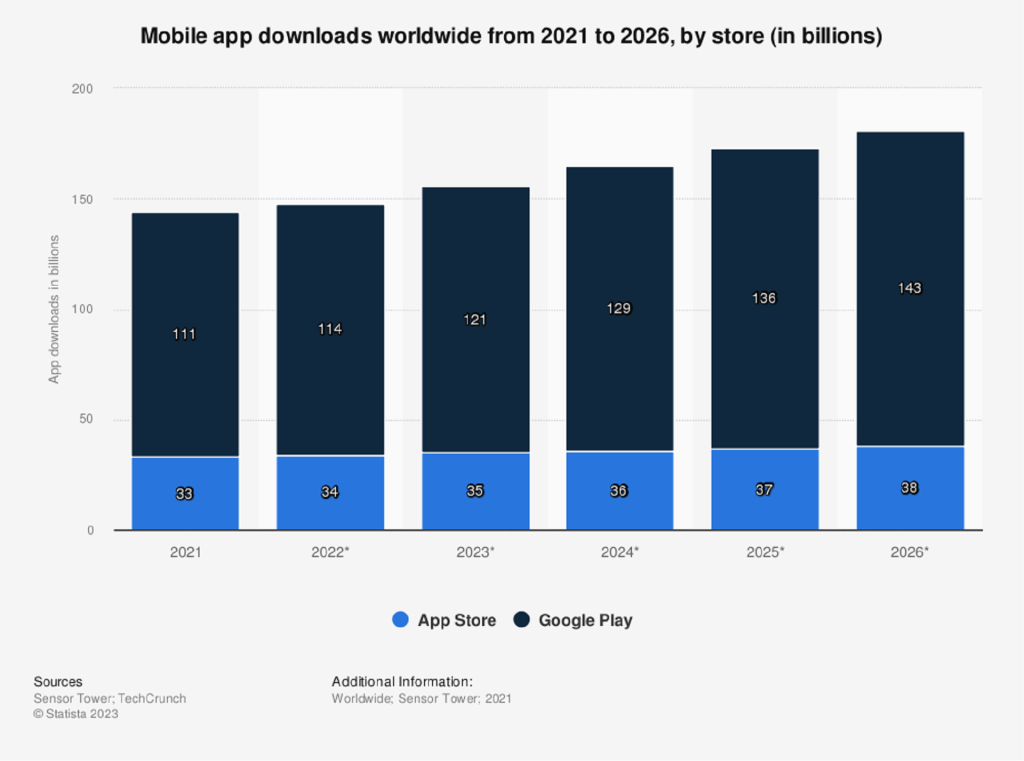
3. Number of mobile app downloads: Here are some interesting app download statistics. About 255 billion apps were downloaded in the year 2022. The numbers are expected to grow steadily year on year. In 2026, the number is expected to reach 181 billion, out of which App Store will contribute 38 billion and Google Play Store will contribute 143 billion downloads. (Source: Statista)
4. Apps currently available on app stores: As of 2022, approximately 1.6 million apps are available in Apple’s App Store and over 3 million Android apps are available on the Google Play Store for downloads. (Source: BankMyCell). More than 3,000 apps are added to both app stores every day, showing the increasing popularity of apps. (Source: Appinventiv)
5. Increasing mobile traffic: Around 60 percent of website traffic comes from mobile devices. 92.3 percent of internet users access the internet using a mobile phone. As most of them are smartphone users, the trend clearly indicates the growing importance of mobile apps. (Source: ExplodingTopics)
Mobile app usage statistics: How popular are mobile apps?
We often wonder— why build an app? The answer is simple. Apps are being used across the globe for education, entertainment, shopping, learning, and whatnot! Here are a few app usage statistics that throw light on the usage of mobile phones and justify why one should create an app using an online app creator:
6. New app downloads: In 2021, more than 100 billion apps were downloaded for the first time. This number is expected to reach around 200 billion by 2025. Clearly, this is one of the best times to create an app and compete for your share of the market. (Source: BusinessofApps)
7. Daily mobile usage: In 2018, an average mobile user spent three hours on their smartphones. (Source: data.ai). In 2022, this duration increased to more than four hours and thirty minutes. (Source: Statista). Companies creating engaging content and mobile apps can leverage this habit of users to their advantage.
8. Daily engagement: In 2022, users spent over five hours and a half daily using apps. (Source: Statista). Around 57 percent of Americans agree that they are addicted to their cell phone. They check their phone around 144 times every day. 75 percent of them check their phones within five minutes of receiving a notification. (Source: Reviews.org).
9. Time allotted to preferred apps: Mobile users spend 88 percent of their time on mobile apps and only 12 percent on mobile websites. (Source: Insider Intelligence). An average of 75 percent of smartphone users reported using their smartphone to chat, and around seven in 10 reported sending emails. Accessing online banking was the third most popular activity while around 62 percent of respondents reported listening to music on their mobile devices. 61 percent of respondents reported consuming video content using their mobile devices. (Source: Statista).
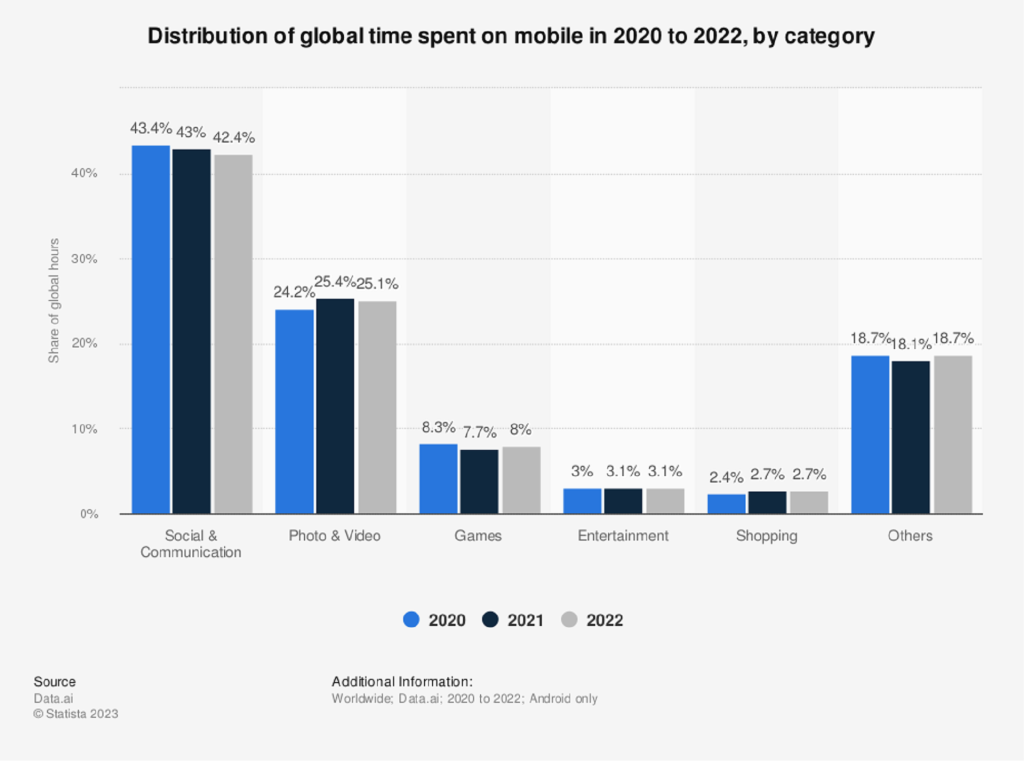
10. Popular social media medium: In 2022, 42.4 percent of all global time spent among smartphone users was spent on social networking and communication apps. (Source: Statista) Clearly, social media apps are more popular than websites. 55 percent of the population, or 4.88 billion people, have social media accounts and the average smartphone user spends more than two hours a day or 70 hours per month on social media apps. (Source: BusinessofApps)
11. Addiction to smartphones and apps: About 75 percent of Americans feel uneasy leaving their phone at home. 60 percent of users sleep with their phones at night. Whereas 55 percent say that they have never gone longer than 24 hours without their cell phone. (Source: Reviews.org)
12. Importance of apps for smartphone users: About 76 percent of millennials find their phones useless without mobile apps. (Source: ComScore). Almost 72.6 percent (around one-third) of internet users will access the web solely via their smartphones by 2025. This is equivalent to nearly 3.7 billion people. This further highlights the importance of mobile applications. (Source: CNBC).
Mobile app usage statistics by age & demography: Who uses apps the most?
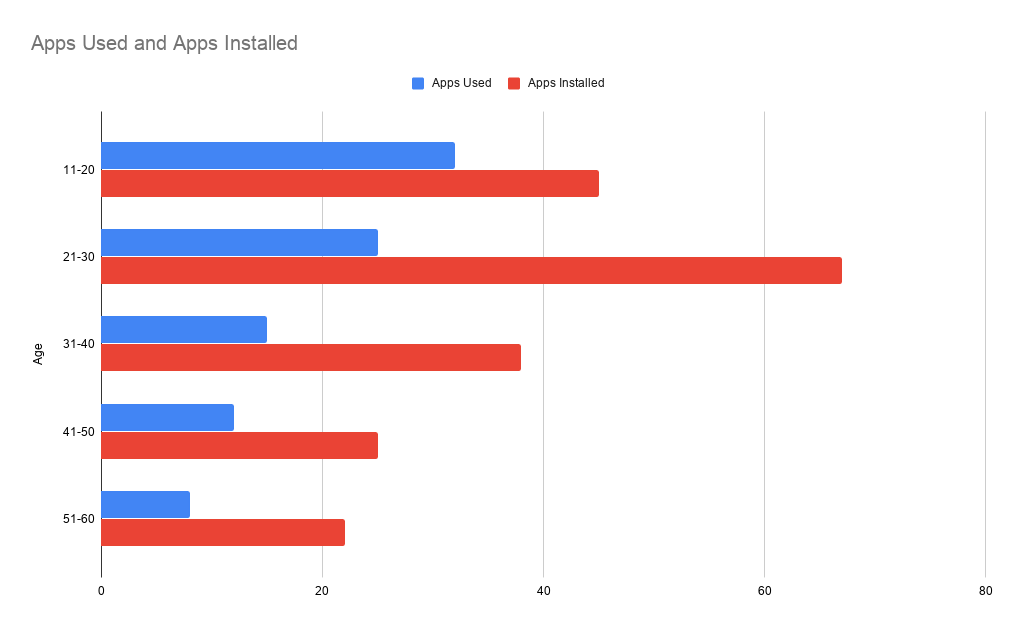
Mobile app usage demographics reveal that users from different age groups behave differently when it comes to mobile apps. Data on mobile app usage by age reveals interesting usage behaviors, as described below:
13. Who uses apps more: As obvious, teenagers and young adults spend more time on apps. 18 to 24-year-olds spend 112.6 hours and 25 to 34-year-olds spend 102.4 hours on apps in a month. Those above the age of 35 spend less than 100 hours a month on apps. Similarly, those over 65 years of age spend less than 51.4 hours a month on apps. (Source: BusinessofApps)
14. App downloads by country: In 2022, China saw approximately 111 billion mobile app downloads. India reached 29 billion downloads during the same year, while the United States reached 12.24 billion downloads. In recent years, mobile app download has seen a positive growth trend in the majority of countries. (Source: Statista)
15. App usage by country: In 2022, Indonesian app users spent 5 hours and 39 minutes using mobile apps on a daily basis, up by four percent when compared to 2021. Brazil ranked second with the highest daily app usage in 2022, with 5.19 hours of daily consumption. Germany and China ranked last with 3.36 hours and 3.33 hours spent by users daily on apps, respectively. (Source: Statista)
16. Change in usage behavior and pattern: 60–70% of users change their app usage patterns during the duration of more than 3 years. This can be credited to changes in demographic attributes like age, social and financial status, location, etc. (Source: Springer Link)
17. Gender distribution of Android app users: During the second quarter of 2022, several mobile app categories saw higher usage from male users than female users. Approximately 92 percent of auto and vehicle apps were used by men, while only eight percent of women engaged with this category. Male users represented 88 percent of the audience for finance and business apps. In comparison, 48 percent of parenting apps were female users during the examined period. (Source: Statista)
18. Gender distribution of iOS app users: During the second quarter of 2022, news and sports apps registered higher engagement from male users. Approximately 87 percent and 86 percent of sports app and news app users engaging with apps in these categories were men. Whereas female users engaged more with book apps, with 54 percent of all app users of this category being women. (Source: Statista)
19. Top app preferences by age: Research shows that one app millennials can’t go without is Amazon, followed by Gmail and Facebook. Whereas 75% of Gen Z users consider Snapchat to be the best platform for staying connected and 71% vote YouTube as the first-choice channel for long-form content. (Source: MarketingDive)
20. Popular app categories by age: Generation Z (those born post-nineties) spends 66 percent of their digital media time on apps. They also spend 30 percent more time on their preferred apps than the rest of the population. (Source: data.ai)
21. Social media app usage: 20 to 29 olds spend the most time on social media apps. 13 to 19-year-olds spend almost the same amount of time on digital apps. As evident, social media app usage percentage decreases among those more than 40 years old. (Source: Oberlo)
22. Apps as a cure for boredom for millennials: About 74 percent of millennials say that they open an app when they feel bored. (Source: ComScore) This gives you a chance to add engaging blogs, videos, and other content so that users engage with your app to cure their boredom.
23. Influence of age on app engagement: Younger users remain the most active demographic across all examined app categories. During the second quarter of 2022, comic apps earned higher engagement from users aged between 18 to 24 years. More than half of all downloads in the music and audio category came from Android users in the 18 to 24 demographic group. Approximately three in 10 users downloading news and magazine apps are aged between 50 and 64 years, while 22 percent of parenting apps were downloaded by users aged 25 and 34 years. (Source: Statista)
Mobile app vs website statistics: Who is the winner?
Why build a mobile app when you already have a website? Is a mobile site enough? Who is likely to win in a mobile app vs website battle? Read these mobile app vs website statistics to make up your mind:
24. Mobile vs desktop usage: Over time, users are spending more time on mobile internet and less on desktop internet. In 2015, mobile traffic was at 31 percent. Now, mobile traffic share is around 55 percent, surpassing desktop computers (43 percent) and tablets (2 percent), as the most used device to access the internet. (Source: Kinsta)
25. Mobile app vs mobile web visitors: Mobile websites receive more visitors than apps, but visitors spend more time in apps. Mobile users spend 90 percent of their time on mobile apps and just 10 percent of their time on mobile websites. (Source: JMango)
26. Mobile app vs mobile site engagement: People view 4.2x more products per session within apps, as compared to mobile sites. Similarly, mobile apps have a 157 percent better conversion rate than mobile websites. (Source: Value Innovation Labs)
27. Mobile app vs website conversions: When compared to mobile websites, conversion rates are three times higher on mobile apps. This makes apps more viable for businesses from a revenue and retention point of view. (Source: JMango)
Mobile app revenue statistics: How much money do apps make?
Mobile apps are responsible for a trillion-dollar industry. Evolving with a mobile-first strategy can boost your growth and revenue. Here are some statistics that highlight how much apps earn on average:
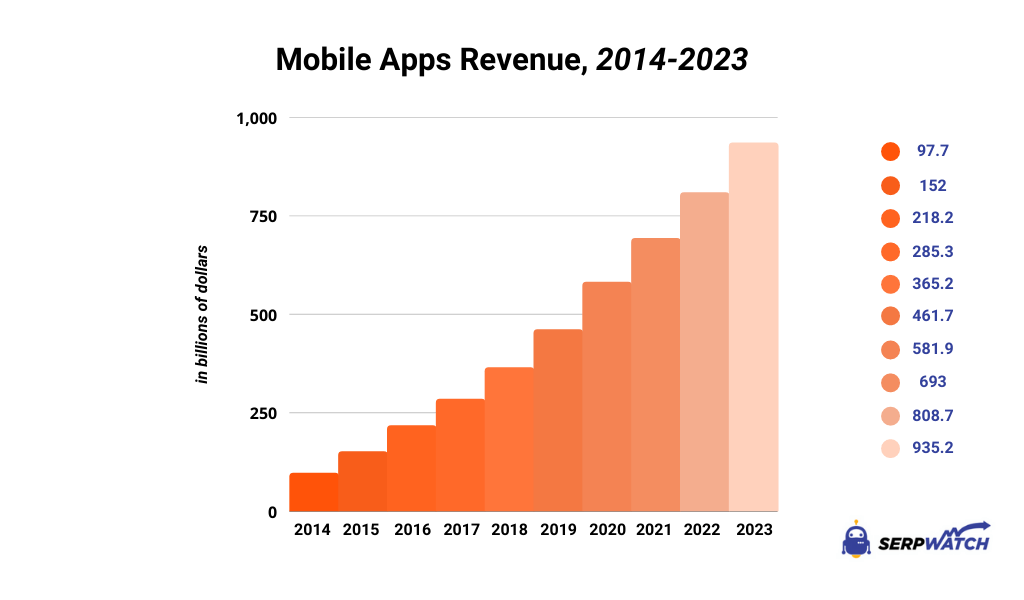
28. Overall revenue via apps: It is true that free and freemium apps rule over paid apps. However, this does not mean that customers do not spend on apps. In fact, the total consumer spending on mobile apps in the year 2022 was around 167 billion US dollars. (Source: Statista). Moreover, as per some predictions, apps will generate over 935 billion US dollars in revenue in 2023. (Source: SerpWatch)
29. Consumer spending on app stores: Consumer spending on the Apple App Store often beats Google Play. In 2022, it accounted for half of the total spending on apps across the globe. In comparison, 27 percent of the global app spending was generated via Google Play. Consumers spent 83 billion US dollars on Apple App Store and 41 billion US dollars on Google Play Store. (Source: Statista).
30. Revenue via in-app purchases (IAP): Users are spending 380 billion US dollars worldwide on in-app purchases. It accounts for 48.2 percent of mobile app earnings as compared to 14 percent from ads-based revenue and 37.8 percent from paid app downloads. (Source: BusinessofApps) In fact, revenue through in-app purchases reached 205 billion US dollars in 2022. (Source: Statista). Games are responsible for 66 percent of IAP spending while other apps stand at 34 percent. (Source: Data.ai).
31. Revenue via free apps: Around 97 percent of apps on Google Play and 93 percent of apps on Apple App Store are free. 98 percent of Google Play revenue comes from free apps. (Source: BusinessofApps)
32. Revenue via paid apps: One in every two smartphone users has never paid for an app. In 2016, about 36 percent of millennials paid to buy five or more apps, while only three percent of users aged 55 years and above did the same. About 36 percent of millennials and 80 percent of users above the age of 55 years bought zero apps. (Source: ComScore). However, the paid app revenue was estimated to have reached 5 billion US dollars in 2022. (Source: Statista).
33. Revenue via mobile app ads: 67 percent of app revenue comes from advertisements while 33 percent comes from IAPs (In App Purchases). Apps like Instagram and TikTok capture around 65 percent of the market while games own 35 percent. (Source: Data.ai) In 2022, advertising revenue in the app market was estimated to have reached 266 billion US dollars. (Source: Statista).
Mobile app industry trends: Where do apps rule?
While mobile apps rule everywhere, they are more dominant in some industries. What are the app-related trends across some of the top industry categories and verticals? Continue reading and find out:
Networking & Communication
34. The top 3 apps are social apps: TikTok, Instagram, and Facebook are the most downloaded apps of 2023. Spotify, Amazon, and Google Maps are some other popular apps belonging to various categories. (Source: BusinessofApps). This shows that social media app development can be a viable business idea.
35. The top app types are social apps: Based on the distribution of usage time, social networking and communication remains the top app category. In 2022, social and communication apps accounted for approximately 42 percent of the time users spent on mobile apps. (Source: Statista). About 69 percent of millennials most commonly use social networking apps, and messaging apps come second at 55 percent. This shows that users prefer apps that enable connecting and communicating with others. (Source: MindSea).
36. Social media app usage: As of 2022, social media audiences amounted to 4.59 billion users as global penetration stands at 54 percent. In the final quarter of 2022, Facebook reported over 3.7 billion monthly core product users. The average daily social media usage of internet users worldwide amounted to 151 minutes per day, up from 147 minutes in the previous year. (Source: Statista).
Banking & FinTech
37. Banking and fintech app downloads: In 2022, banking and fintech app downloads surged 54% and exceeded 26 million. (Source: Finbold).
38. Banking and finance app usage: Six out of every 10 mobile users prefer finance apps over websites. Around 90 percent of users use mobile banking apps to view their account balances. 89 percent of all users and 97 percent of millennials rely on mobile banking apps. (Source: Storyly).
39. Time spent on banking and Fintech apps: Time spent on fintech apps per user per day rose in 2022. It went up from 5.13 minutes per session per day on Day 1 to 5.67 minutes per session. As a result, global mobile payments are projected to surpass 2 trillion US dollars by 2023. (Source: Business of Apps).
Food & Restaurants
40. Food and drink app downloads: In 2022, the number of food and beverage ordering app downloads worldwide amounted to about 717 million. Zomato was the most popular online food delivery app with over 55 million downloads. Uber Eats ranked second with 47 million downloads. (Source: Statista)
41. Food delivery app revenue: Revenue in the Online Food Delivery market is projected to reach 1 trillion US dollars in 2023. Pacing at an annual growth rate (CAGR 2023-2027) of 12.78%, it is estimated to reach a market volume of 2 trillion US dollars by 2027. (Source: Statista)
Suggested Read: 70+ Online food ordering statistics that every restaurateur should know
Travel & Transportation
42. Mobile is the most popular travel booking mode: Smartphones are the preferred method of research for travel. Over 70 percent of new tourists research holiday locations on their phones. In 2023, over 700 million people around the world are expected to make travel bookings online. Moreover, 83% of adults in the United States want to book online instead of going to a travel agent. (Source: Only Wander Lust)
43. Travel apps and bookings: There were slightly over one billion travel app users in 2022. Online travel bookings surpassed previous records set in 2019, with a booking value of 798 billion US dollars in 2022. (Source: BusinessofApps)
44. Growth of car rental apps: In 2018, the usage of the top five car rental apps grew by 25 percent. New app installations increased by 27 percent in 2022, while MAUs (Monthly Active Users) of car rental apps increased by 19.4 percent. (Source: Apptopia)
45. Global ride-sharing market: The global ride-sharing market is expected to grow by more than 133 percent between 2022 and 2028. The value is expected to amount to around 226 billion US dollars in 2028. (Source: Statista)
46. Global online travel booking service: The global online travel booking service market size was valued at 519.1 billion US dollars in 2021. It is expected to expand at a compound annual growth rate of 9 percent from 2022 to 2030. (Source: Grand View Research)
Retail & Shopping
47. Growth of retail m-commerce: At least 79% of smartphone users have shopped online. There are more than 2 billion mobile payment users around the globe. Therefore, the number of online shoppers is estimated to be around 4 to 5 billion. (Source: Colorlib)
48. Top mode for online purchases: Mobile phones account for the highest number of visits and orders. As of the first quarter of 2023, smartphones accounted for approximately 74 percent of retail site traffic worldwide and generated 63 percent of online shopping orders. (Source: Statista)
49. Mobile shopping usage trends: 83% of users use some form of shopping app on their smartphones while shopping inside a store. 67% of consumers download the merchant app they are interested in. (Source: Emizentech)
50. Number of retail apps users have: Users are downloading more retail apps every year on their smartphones, and they have about six to ten retail apps on their phones. Moreover, 71 percent of retail website traffic comes from mobile devices, most of which include apps. (Source: Statista)
51. Time spent on retail apps: Users spend an average of 4.6 to 5 minutes on shopping and retail apps. The cumulative time spent on retail apps reached 100 billion hours globally. (Source: Tidio)
52. Buyers prefer apps over websites: 85 percent of consumers of top eCommerce platforms like Amazon favor shopping on mobile applications over mobile websites. (Source: Statista). Millennials especially embrace in-app shopping. 61 percent of Millennials say they download retail apps and 58 percent of millennials mentioned that they preferred purchasing through apps. (Source: JMango360)
53. Ease of shopping through apps: About 72 percent of consumers perceive shopping through mobile apps to be easier. Mobile apps have become the preferred shopping choice of users for almost every platform. As of March 2019, Amazon saw 85 percent of mobile activity coming through its app. (Source: Statista)
54. Influence of apps on shopping decisions: About 82 percent of people use their phone to check before making a purchase in a store. A similar percentage of shoppers use social media apps to make online purchases. (Business of Apps)
55. Role of apps in eCommerce conversions: People view 4.2 times more products on apps as compared to mobile sites. Apps also push more people down the purchase funnel, with 3x higher conversion rates compared to mobile sites and 1.5x more conversions per session than desktop. (Source: JMango)
56. Sales through mobile commerce: As of January 2022, mobile commerce accounted for nearly 65.7 percent of all global e-commerce retail sales. Forecasts indicate that by 2026, the online segment will make up close to a quarter of total global retail sales. (Source: Statista)
57. Abandonment of shopping carts: Shopping cart abandonment rates on mobile sites are higher than on desktop. 73.4 percent of mobile site users abandon their carts. Mobile apps solve this problem and reduce the abandonment rate. (Source: JMango360)
Mobile app design & performance figures: How important is UI/UX?
Here are some app design and development statistics that app developers and development teams must keep in mind while creating mobile apps:
58. Role of good UI/UX: Lack of user-friendliness is one of the biggest reasons behind mobile site and mobile app abandonments. About 85% of users believe a business’ mobile page or app should be better than the desktop version. (Source: UXCam)
59. Effect on brand image: About 65 percent of users say that if they have a poor mobile experience with a brand, then the brand’s image is negatively impacted. Hence, one should use a quality online app creator to build an app. (Source: Access)
60. Ideal app loading time: About 43 percent of users are unhappy if an app takes more than three seconds to load, highlighting the need to create efficient and light apps. (Source: App Samurai). If an app takes too long to load, about 70 percent of the users abandon the app. (Source: Think Storage)
61. Performance affects retention: About 71 percent of uninstalls are caused by app crashes. This highlights the need of creating stable apps. (Source: App Samurai).
62. Inconsistencies in the app’s interface: About 58 percent of users say that they are frustrated by inconsistencies in an app’s interface. This reiterates the need for a good UI/UX. (Source: Perfecto Mobile)
63. Overall app performance: If an app’s overall performance is not good, 52 percent of users are frustrated by it and this can lead to uninstallations. (Source: Perfecto Mobile)
64. Value from an app: About 29 percent of users tend to abandon apps right away if they don’t find any value in the app. Therefore, the app must offer valuable content to users. (Source: Think Storage)
65. Impact of data consumption: About 37 percent of millennials consider data usage as an important factor in deciding if they should download and use an app. An app that consumes excessive data might be at a high risk of getting deleted. (Source: MindSea)
Mobile app marketing statistics: Are apps used for advertisement?
From marketing apps on apps, to advertising other products and services, mobile apps have become a wholesome promotion channel. Go through the statistics below and know how:
66. Mobile apps as a marketing tool: About 54 percent of marketers use a mobile app platform to market to customers and prospects. (Source: Salesforce).
67. Apps help with multi-channel marketing: Multi-channel marketing is essential. 98 percent of American consumers switch between devices every day. 60 percent of millennials expect to have consistent brand experiences across every channel. This highlights the growing need for apps. (Source: BlueShift).
68. Mobile advertising spending: In 2022, mobile advertising spending reached a record 327 billion US dollars worldwide. This figure will reach around 400 billion by 2024. (Source: Statista).
69. Subscription to push notifications: Push notifications are a great tool for marketing. Around 60 percent of mobile users subscribe to push notifications. On the contrary, only 30 percent of desktop and 10 percent of tablet users agree to receive push notifications. (Source: MoEngage). Clearly, mobile notifications have the ability to perform better.
70. Customer acquisition costs: Acquiring new app users has become costlier due to the growing competition. Customer Acquisition Costs (CAC) have risen by 60% in the last five years to an average of 29 US dollars per user. (Source: Business of Apps). However, this just goes on to show that the app market is stronger than ever.
Suggested Read: Top 70+ Mobile app marketing and advertising statistics – How do companies sell apps?
App Store Optimization statistics: How are apps made visible?
Creating apps is just half the battle. Getting the required exposure and visibility on the app stores is also important as most apps are discovered through app stores. Here are some stats that shed more light:
71. Discovery of apps: 51 percent of users learn about an app from their friends or family. 48 percent of users discover apps by browsing app stores and 34 percent convert by seeing a recommendation. Seeing ads and promotions of apps are other popular methods of app discovery. (Source: Think With Google).
72. Mobile app updates: Over half of the 100 most successful apps push an update every ten days. (Source: Storemaven).
73. Importance of app store reviews: 77 percent of people read at least 1 review before downloading a free app. 80 percent do the same for a paid app. (Source: BusinessofApps)
74. Conversion through app store pages: App Store page view to install rate is 33.7 percent. Whereas Google Play page view to install rate is 26.4%. Whereas the average time spent on the App Store page is 10 seconds and Google Play Page is 14 seconds. Clearly, optimizing your mobile app listings for app stores can get you more downloads. (Source: BusinessofApps).
Forecasts of the mobile app industry: What does the future look like?
Mobile apps are becoming more and more important and will continue to grow in the future. Here are some notable forecasts related to the mobile app industry:
75. App download forecast: In 2026, consumers are projected to download 143 billion mobile apps from the Google Play Store, up by almost 30 percent from 111 billion apps downloaded in 2021. Similarly, the Apple App Store is expected to generate 38 billion downloads, an increase of around 15 percent in five years. (Source: Statista)
76. App economy forecast: Total revenue through apps is expected to show an annual growth rate (CAGR 2022-2027) of 8.58 percent, resulting in a projected market volume of US 756 billion by 2027. (Source: Statista)
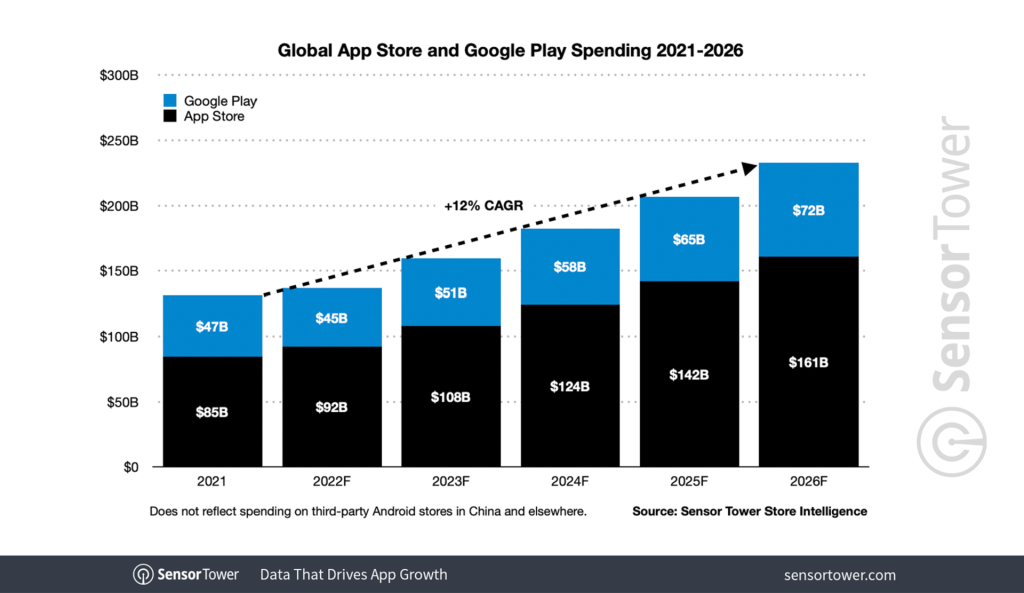
77. Future of app stores: In 2027, the spending on the Apple App Store will reach 125 billion US dollars. Whereas combined user spending in the App Store and Google Play is estimated to reach almost 186 billion US dollars. (Source: Statista).
78. Mobile payment forecast: The global mobile payment market is projected to grow from 2.98 trillion US dollars in 2023 to 18.84 trillion US dollars by 2030. This shows a CAGR of 30.1 percent during the forecast period. (Source: Fortune Business Insights)
79. Top app categories forecast: Keeping the ever-leading gaming apps aside, social apps, entertainment apps, and productivity apps will continue to grow as the top non-gaming app categories across app stores. Social and entertainment will likely tie for a six percent revenue share in 2026. (Source: Sensor Tower)
Miscellaneous statistics: Some more notable facts & figures
With mobile apps, there is no end to the growth, evolution, and statistics. Here are some more numbers that will give you a concluding picture of the importance of mobile apps:
80. Top 10 apps: Among the top 10 Android apps, Google owns five, Meta Platforms owns three, and Amazon and Samsung own one app each. (Source: Wikipedia)
81. Investment in apps by businesses: As per a study, more than half (47 percent) of all online stores have invested in one or more apps. Around 45 percent have invested in both Android and iOS apps. (Source: EcommerceDB)
82. Cost of mobile app development: The average cost of mobile app development has now grown to just over 66 thousand US dollars. (GoodFirms). This makes custom app development a very expensive process. The cost can go up or down depending on the needs of the client. However, trends show that app development will become budget friendly due to the availability of no-code solutions and white label development software.
83. Time taken to build an app – The average time needed to create an app is around four and a half months. (GoodFirms). The time can change depending on the customized project requests. Again, new and democratic technologies like low-code and no-code app builders will be contributing to expediting app development projects and reducing the time of delivery.
84. Challenges of app development: There are many small businesses that still do not have apps. Not having technical knowledge or workforce (50 percent), lack of time (23 percent), expensive processes (22 percent), and security concerns (5 percent) are the biggest challenges in app development. (Source: Rocket Farm Studios). This shows that the app development market still has enough potential that can be tapped with the right kind of solution.
How to create an app in 3 easy steps?
AppMySite is the ultimate solution for creating apps without any coding. It comes with a premium app builder that is cost-effective and enables you to create powerful apps in minutes.
If you’re convinced to build an app for your business, here are the three steps you need to follow with the AppMySite’s free app maker:
1. Get onboard with AppMySite
Start by subscribing to AppMySite and selecting the app development solution that suits you the best. Enter the required details, check the boxes, and get the ball rolling.
2. Personalize your app
Design your app’s crucial elements and screens. Use AppMySite’s extensive design features or upload your own artwork, whatever suits you the best.
3. Build and publish your app
Once you are done with fine tuning the design, settings, and features, you can generate a build for both Android and iOS apps within your AppMySite account. Preview your apps and publish them to Google Play and Apple App Stores.
Conclusion
Once you have studied all the app stats and mobile usage statistics given above, and you are assured that building an app will benefit your business, you can use WooCommerce or WordPress app builder to create a premium app.
Else, you can go with any other solution offered by AppMySite and build the app of your dreams. To learn more about mobile app design, development, marketing, etc., you can explore our other blogs.
If you have any questions related to anything discussed here, you can drop a line in the comment section below or get in touch with us directly. Join our tribe of millions of subscribers and give your business the uplift it needs.