Pizza Hut is believed to be the pioneer of online food ordering and the first order for a pizza was placed in 1994. Then came the first holistic online food ordering service, World Wide Waiter (currently known as Waiter.com), which was founded in 1995.
Ever since then, there has been no looking back. Today, there are hundreds of online food ordering services across the globe attracting millions of customers every day.
Technology has been contributing to this expansion and the industry has been flourishing ever since it has become easier to build a website and make an app. In fact, 95 percent of restaurant owners agree that technology helps them run their business with more efficacy.
So, if you are a restaurateur or have anything to do with the food and beverage business at large, you have landed at the right place. Go through our colossal list of statistics and get some inspiration for taking your business online or expanding it.
Some general statistics and facts
Let us start with discovering some general statistics related to the online food delivery business and get a hold of the overview of the online food and beverage industry:
- 70 percent customers prefer ordering food online and want it delivered. (Food delivery news)
- The number of users in the online food delivery industry is expected to reach to a whopping 2,656 million by 2026. (Statista)
- About 60 percent of operators say that offering delivery has generated incremental sales. (Restaurant Business)
- 59 percent of restaurant orders from millennials are takeout or delivery. (Fundera)
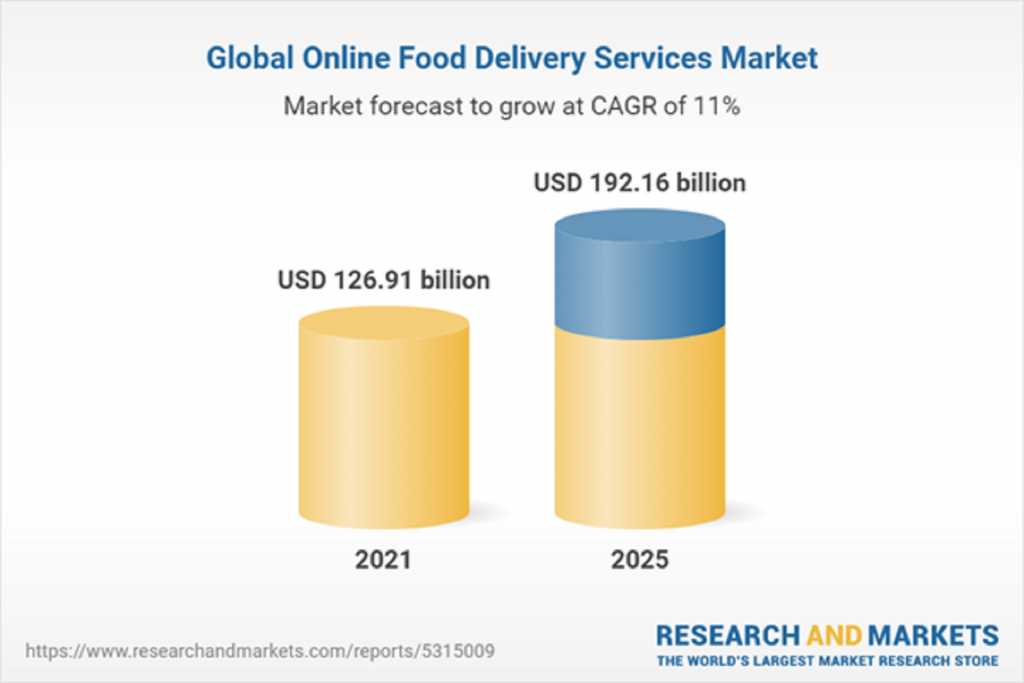
- Online food ordering industry is expected to be worth USD 200 billion by 2025. (Forbes)
- The average volume per person in the US food market is expected to amount to 537.5kg in 2022. (Statista)
- Customers spend more on online orders than on on-premise orders. Digital ordering is growing at around 3x higher rate as compared to on-site ordering. (Upserve)
- Online food ordering now accounts for roughly 40 percent of the total restaurant sales. (Zippia)
- China is the largest and USA is the second-largest consumer of online food orders. (BusinessofApps)
- One in three customers in the US use online food ordering services at least twice in a week. (Tacit)
- 35 percent of guests discover restaurants through online reviews and the restaurant’s website. 49 percent of them find it through recommendations from friends and family. (FinancesOnline)
- Customers who place an online order with a restaurant will visit that restaurant 67 percent more frequently than those who don’t. (Upserve)
- 63 percent of consumers agree that it is more convenient to get delivery than dining out with a family. (Upserve)
- 87 percent of Americans who use third-party food delivery services say that it makes their lives easier. (Upserve)
Suggested Read: How to start a food blog – The complete guide with bonus tips for marketing
Statistics related to spending and revenue
The food and beverage industry is not very far behind in terms of user spending and revenue when compared with other retail sectors and businesses. Let us find out how much users are spending on online food delivery and get a better understanding:
- Market revenue for the food delivery industry has increased by 20 percent in the past five years. (Lavu)
- In the United States, the revenue has tripled in the past five years. It’s predicted to grow to USD 43 billion by 2025. (Statista)
- China is the leader when it comes to revenue through online food delivery and is valued at around USD 158,137 million this year. (Statista)
- 34 percent of consumers spend at least USD 50 per order when ordering food online. (Upserve)
- 27 percent of people say they would be willing to pay extra for their food to arrive faster. (HotelTechReport)
- The Y-O-Y (year on year) projected value for global food delivery is as follows:
- 2020: USD 100 billion
- 2021: USD 120 billion
- 2022: USD 140 billion
- 2023: USD 165 billion
- 2024: USD 200 billion
- 2025: USD 230 billion
- 2026: USD 265 billion
- 2027: USD 300 billion
Suggested Read: Top 75+ mobile app statistics – Market size & usage
Social media & marketing statistics
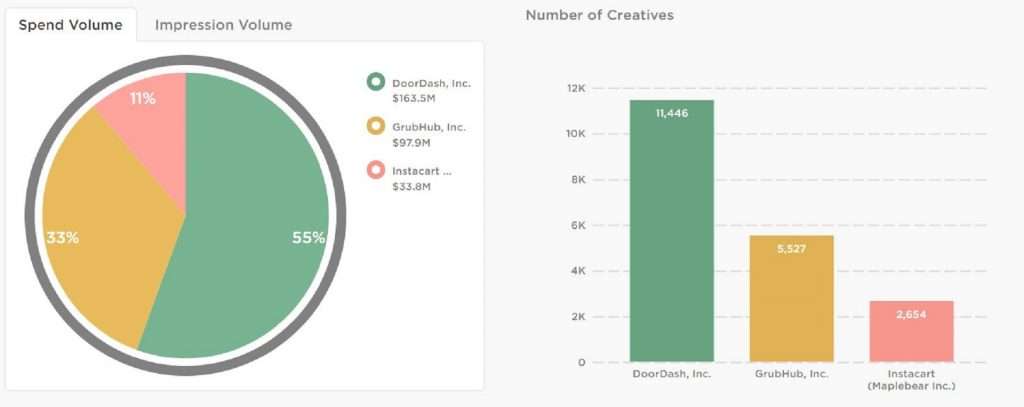
Online food delivery businesses and aggregator platforms spend a huge amount on advertising and marketing that goes on to show how successful the industry is. The image above shows how much some popular food delivery apps spend on social media promotions.
Here are some stats related to social media and marketing that throw more light on the subject:
- 67 percent of restaurants used social media advertising in 2019. (Toast)
- 92 percent of restaurants are using Facebook for social media branding and marketing. (MyMarketing)
- 10 percent of restaurant guests said that a restaurant’s social media or email marketing tactics influenced them to return to a restaurant. (FinancesOnline)
- A study showed that for food and beverage companies, photos have an engagement rate per post of around 1.3 percent which is better than carousel or video content. (FinancesOnline)
- 20 percent to 40 percent customers are more likely to spend time and money on those restaurants that they have engaged with on social media. (FinancesOnline)
- The average engagement rate for food and beverage brands on Twitter is 0.064 percent whereas the general rate for all industries is 0.045 percent. (FinancesOnline)
- In 2020, hashtag food (#food) had 1,129,432 mentions on Twitter and 25,279,694 mentions on Instagram. (FinancesOnline)
Suggested Read: Effective tips to create Carousel Ads for boosting mobile app downloads
Statistics related to the effect of pandemic
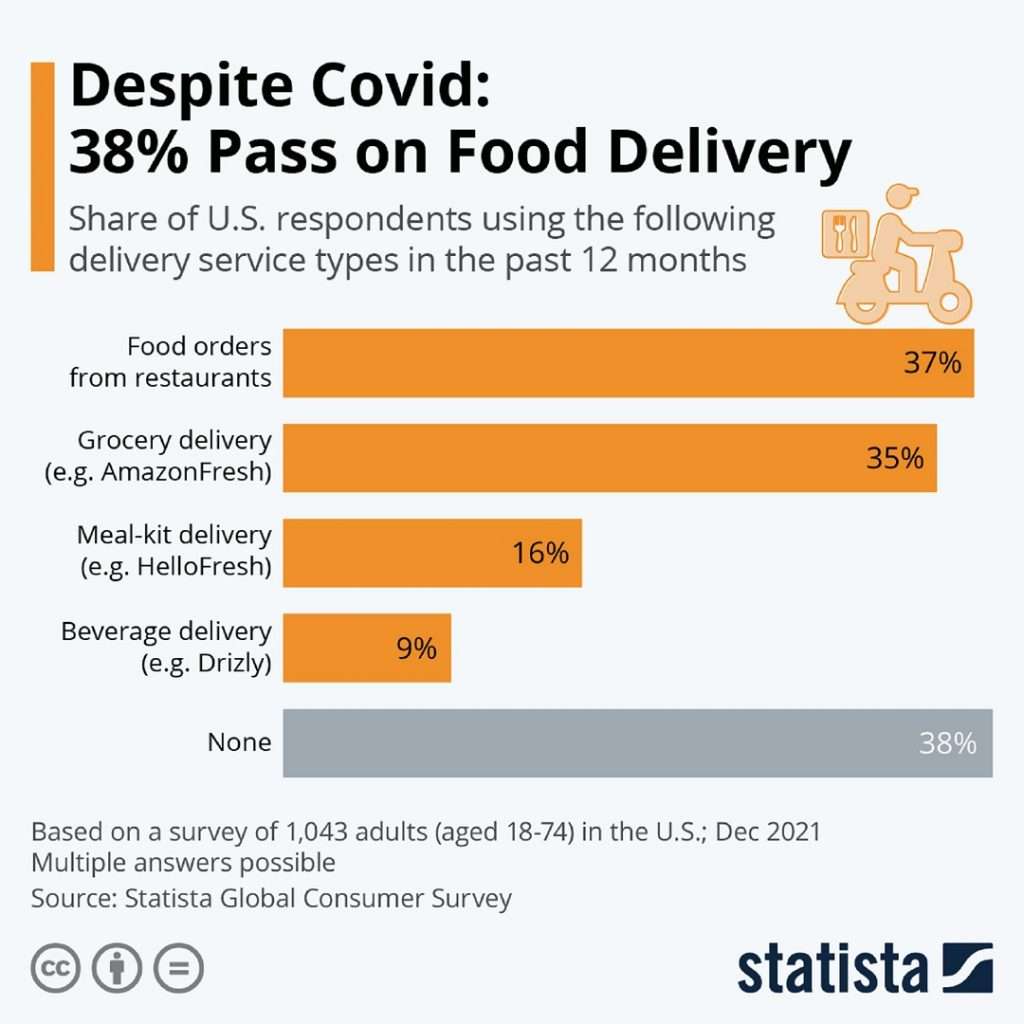
The COVID-19 pandemic led to a lot of turbulence in the online food and beverage delivery industry. Some believe that it got hit and some believe that it stayed afloat despite all odds. The image above also depicts that the number of people opting in for delivery is more than the number of people who passed.
Discover all the stats listed below and know for sure:
- 55 percent of diners have been eating at home since the start of the pandemic. (FinancesOnline)
- 68 percent of consumers said that they were more likely to order takeout in 2021 than they were pre-pandemic. (HotelTechReport)
- 23 percent of people agreed to only ordering for pickup or delivery in the year 2020. (SevenRooms)
- 51 percent of Americans felt comfortable ordering for pick-up during the pandemic. (SevenRooms)
- During the pandemic 43 percent US consumers preferred placing food orders through online ordering apps. (SevenRooms)
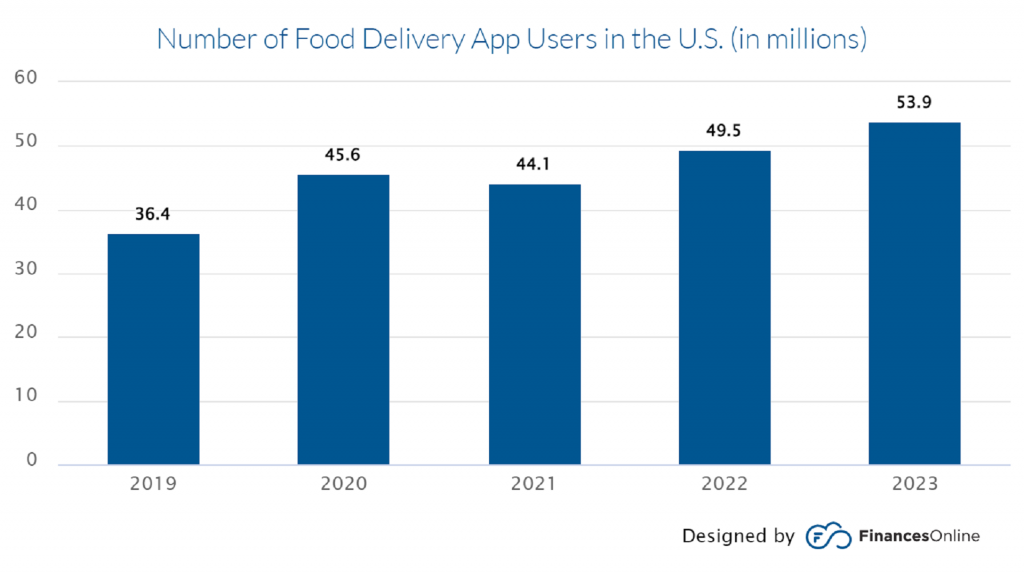
- In 2020, more than 45 million Americans used a food delivery app, which was a 25 percent increase since the previous year. (SevenRooms)
- In 2020, at least 3 out of 5 restaurants started offering contactless delivery, and regular food delivery options to increase sales. (BlinkCo)
- Ever since COVID-19 happened, almost 60 percent of restaurants have reportedly witnessed increases in their revenues. (BlinkCo)
- Grubhub, a popular food delivery app, grew its customer base by 35 percent between 2019 and 2020. (BlinkCo)
- Three in ten restaurateurs predict that off-premise demand will remain in trend even after the pandemic ends. (SevenRooms)
- 23 percent of restaurants say their customers are more engaged with their online offerings now compared to pre-pandemic times. (HotelTechReport)
- 34 percent of diners said that the availability of contactless or mobile payment options are important technologies during and after COVID-19. (FinancesOnline)
- Nearly half of restaurateurs said they added food delivery options to adapt to the changing scenario after pandemic. (FinancesOnline)
- QR code payments is expected to see a growth of 240 percent between 2020 to 2025, following the demand for cashless payments due to the pandemic. (FinancesOnline)
Suggested Read: Create a restaurant app and offer no-contact eMenu to your customers
Online food ordering statistics: Web vs Mobile App
Businesses often wonder whether they should stick to websites or are mobile apps more powerful. Let us discover some statistics related to the same and resolve that conflict.
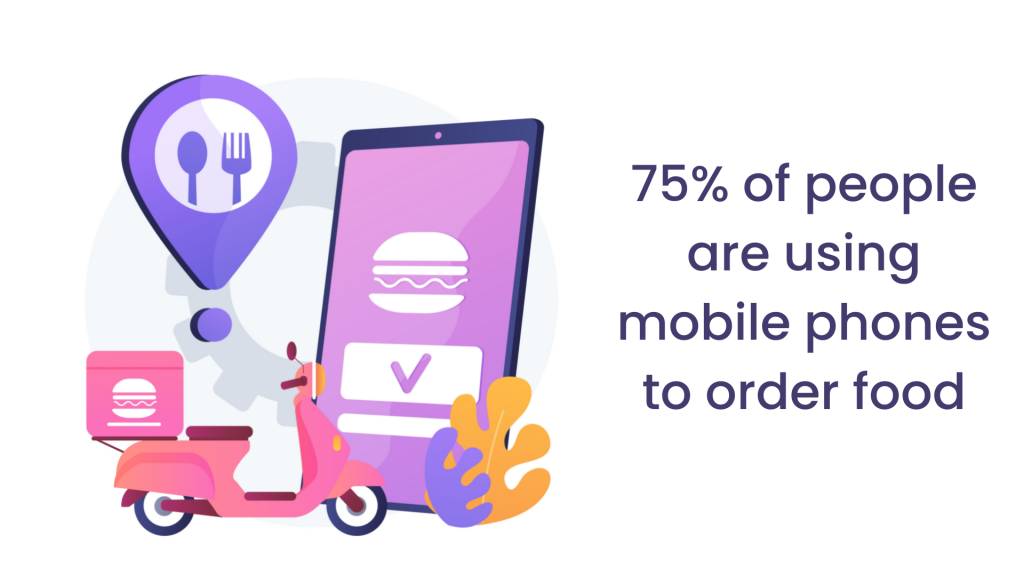
- Nearly 75 percent of people are using mobile phones to order food. (HotelTechReport)
- 92 percent of all top-performing restaurants in 2020 offered mobile order-ahead feature and/or loyalty rewards programs. (FinancesOnline)
- Using digital menu boards that can be viewed on phones can increase yearly store sales per unit by USD 16,000. (FinancesOnline)
- In 2019, 51 percent of diners ordered directly from a restaurant’s website, 38 percent used an online ordering aggregate site, while 29 percent used an app. (FinancesOnline)
- As of March 2020, 38 percent of American consumers had ordered food via a food delivery app. This number went up to 41 percent in 2021 indicating a constant growth. (HotelTechReport)
- 49 percent of restaurant operators think that a mobile payment option is a must-have technology for diners. (FinancesOnline)
- Around 50 percent of consumers are open to using a QR code as a mode of payment in bars and restaurants. (FinancesOnline)
- 58 percent of consumers in the US prefer cashless payments. (FinancesOnline)
- 70 percent of a restaurant’s total digital orders come from its branded app or website. (FinancesOnline)
- Orders placed via smartphone and mobile apps became a USD 38 billion industry in 2020.
- Most online orders, about 60 percent, are made on smartphones. (Upserve)
- Orders placed via mobile app make up nearly a quarter of all sales at Starbucks locations in the US. (GeekWire)
- As of late 2020, mobile orders comprised around 75 percent of all Domino’s sales. (HotelTechReport)
- Pizza chains reported an 18 percent increase in customer spend from online/mobile orders vs. phone orders. (Upserve)
- On average, people have two delivery apps on their phones and use them three times per month. (SevenRooms)
- Food delivery and online ordering apps were some of the most popular app downloads in 2020. UberEats and the McDonalds app both saw 82 million global downloads in 2020 which was more than what Google Maps, Tinder or eBay managed to earn. (HotelTechReport)
Suggested Read: 10 statistics that show why you should create an app for your business
Online food ordering statistics: Aggregator platforms vs Own platforms
Whether I should go with third-party food ordering platforms or launch my own app? This is the question that causes anxiety among many restaurant owners. Explore some statistics and arrive at a conclusion accordingly.
- 30 percent of American diners who don’t use third-party online ordering apps avoid them specifically because they want to support restaurants directly. (SevenRooms)
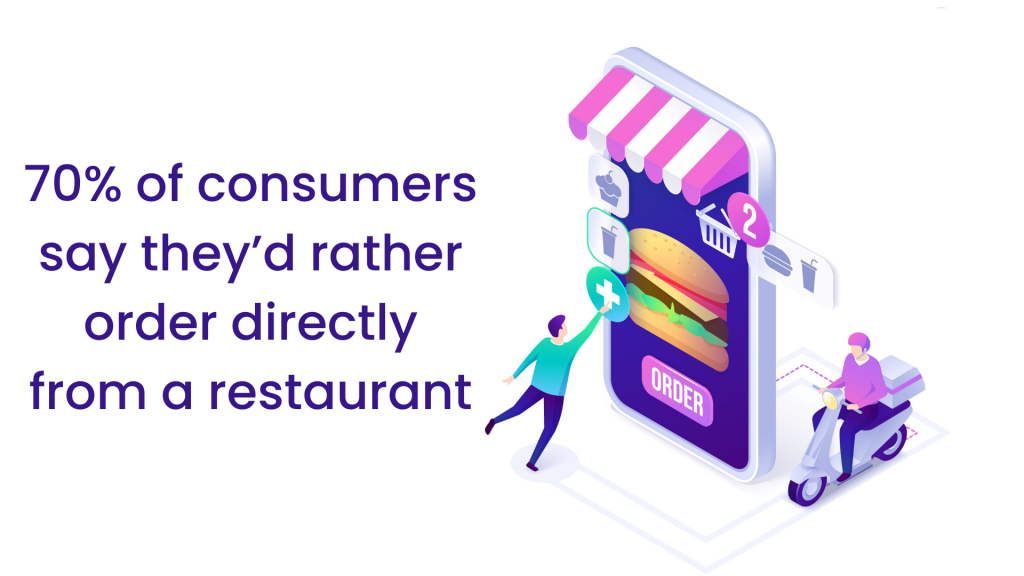
- 70 percent of consumers say they’d rather order directly from a restaurant, preferring that their money goes straight to the restaurant and not a third party. (Hospitality Technology)
- The online food delivery market’s largest segment is direct-to-consumer ordering as opposed to third-party ordering. (SevenRooms)
- 78 percent of off-premise orders are placed directly, while 22 percent are placed through third-party platforms. (SevenRooms)
- At the end of the year 2020, direct ordering platforms reported revenue of approximately USD 16 billion. (SevenRooms)
- Third-party platforms consume up to 30 percent of restaurant revenue in commissions. (SevenRooms)
- 43 percent of restaurant professionals said they believe third-party apps interfere with the direct relationship between a restaurant and its customers. (Upserve)
Suggested Read: Selling on platforms like Amazon vs setting up your own online store
Some miscellaneous statistics
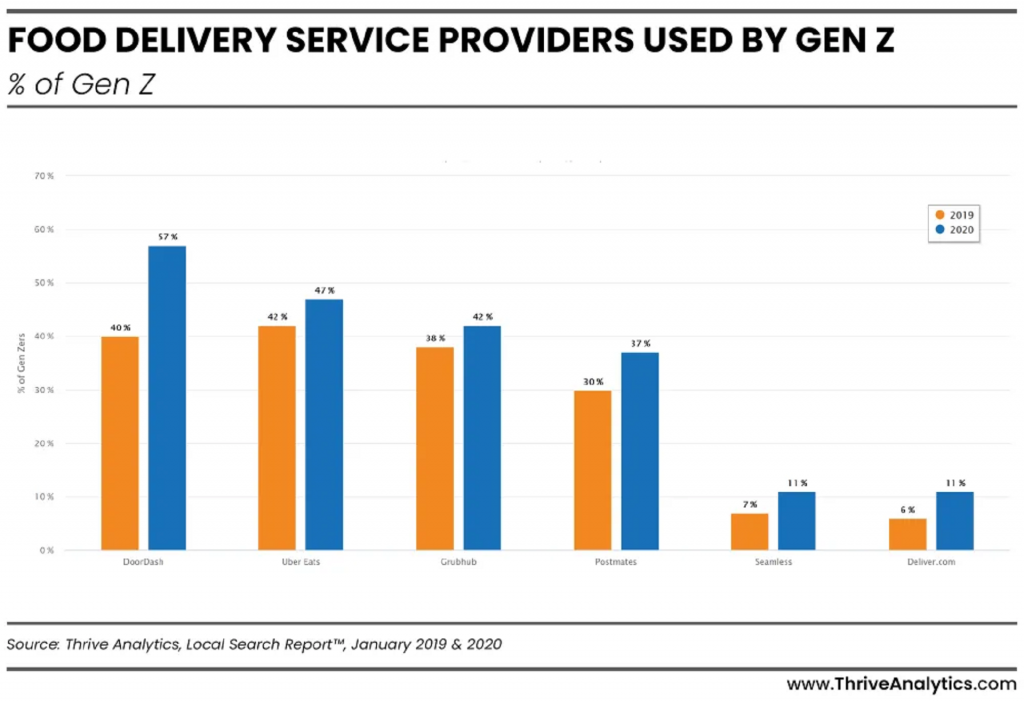
Source: Thrive Analytics
During our study, we found some statistics that were interesting enough and worth all the extra minutes to spare. Go through those additional statistics as listed below and savor extra treats:
- Up to 59 percent of millennial orders are for off-site dining. (Fundera)
- 57 percent of millennials want restaurant food delivered so they can watch movies and TV shows at home. (Upserve)
- 64 percent of millennial respondents say that food delivery and takeout are essential part of their living. (HotelTechReport)
- Americans who have not used a third-party restaurant delivery service say fast delivery (31 percent), restaurant selection (28 percent), low order minimums (27 percent) and first-use coupons (26 percent) can inspire them to try it. (Upserve)
- 33 percent of consumers say they would be willing to pay a higher fee for faster delivery service. (Upserve)
- French fries were the most popular menu item in the US on UberEats in March 2020, while cheesecake was the most frequently ordered dessert. (HotelTechReport)
- Mother’s Day, New Year’s Eve, and Halloween are the most popular holidays for food delivery. (HotelTechReport)
- 53 percent of millennials are more likely to pick a restaurant if they offer alcoholic beverages with their to-go order. (Hospitality Technology)
- Ghost kitchens are commercial kitchens that serve food to customers exclusively via delivery. Predictions show that ghost kitchens will grow to a trillion-dollar industry by 2030. (Euromonitor)
- Top food delivery apps across the globe include Uber Eats, Just Eat, Grubhub, Doordash, Takeaway, Deliveroo, Zomato, etc. (BusinessofApps)
Suggested Read: The ultimate list of 70+ eCommerce facts and statistics for 2022
Wrapping up
That was all from our end today. All the statistics indicate that the online food ordering industry is on the trajectory of growth and will continue to amplify in the coming years.
However, it is better for restaurateurs to launch their own app rather than relying on a third-party aggregator platform for doing business with online customers. It eliminates the need for giving commissions on every sale and enables you to interact with your consumers directly.
If you are worried about the hefty costs and complicated development methods, then shed all your worries right away. AppMySite’s online app maker is an all-rounder, and the restaurant mobile app builder is especially equipped to take care of all your online business needs.Go ahead and checkout the app builder for yourself. You can build an app for free and then subscribe to pay only when you are content with the platform. Whether it’s building apps for F&B businesses or grocery app development, AppMySite is ideal for endless use cases. Even if you have a cafe business, you can build a coffee shop mobile app with no-code tools like AppMySite. So, try it out now and tell us about your experience in the comment section below.