The attempt towards eCommerce began somewhere around late 70’s to early 80’s. However, it was the 90’s when eCommerce truly started taking shape after the arrival of the World Wide Web.
Book Stacks Unlimited, an online bookstore created by Charles M. Stack in 1992, offered one of the earliest web-based shopping experiences.
However, at the beginning, there were many concerns regarding safety and security. Then came Secure Socket Layers (SSL), an encryption certificate created by Netscape in 1994 that ensured safe transmission of data over the internet.
Amazon was officially launched in 1995 soon after, and it started as an online bookstore becoming one of the pioneers of the online shopping industry, and the rest is history!
Ever since then, eCommerce has been constantly expanding and growing and millions of businesses are building websites and creating an app to join the industry and reach their customers online.
Let us get a statistical overview of the eCommerce industry and discover some numbers and facts about its expanse.
In this blog
- Some eCommerce statistics in general
- Statistics related to revenue, payment, and market share
- Mobile eCommerce Statistics
- Consumer-based eCommerce statistics
- eCommerce statistics related to marketing & branding
- Social media related eCommerce statistics
- Shopping Cart related eCommerce Statistics
- Overall impact of COVID-19 on the eCommerce industry
Some eCommerce statistics in general
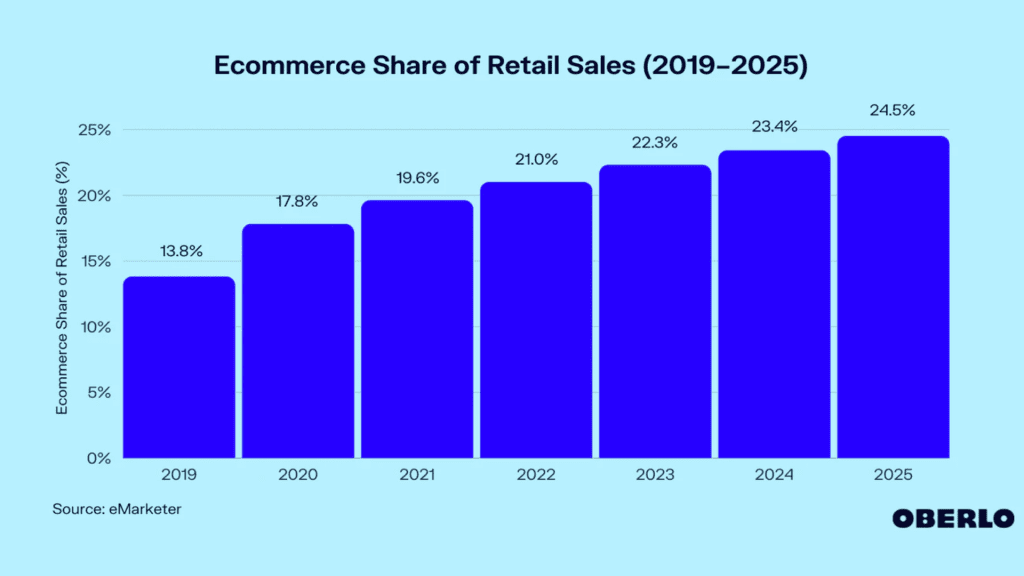
Most studies place the global number of eCommerce websites at somewhere around 12 million to 24 million. However, less than one million sites are able to sell more than USD 1,000/year.
While the numbers are tricky, the ultimate fact is that numerous new eCommerce websites are getting created each day.
In fact, studies show that approximately 175 new websites are created every minute and thus, around 252,000 new websites are created every day. Out of this, a huge share is that of eCommerce websites.
Let us discover some more cool stats that give an overview of the eCommerce industry in general.
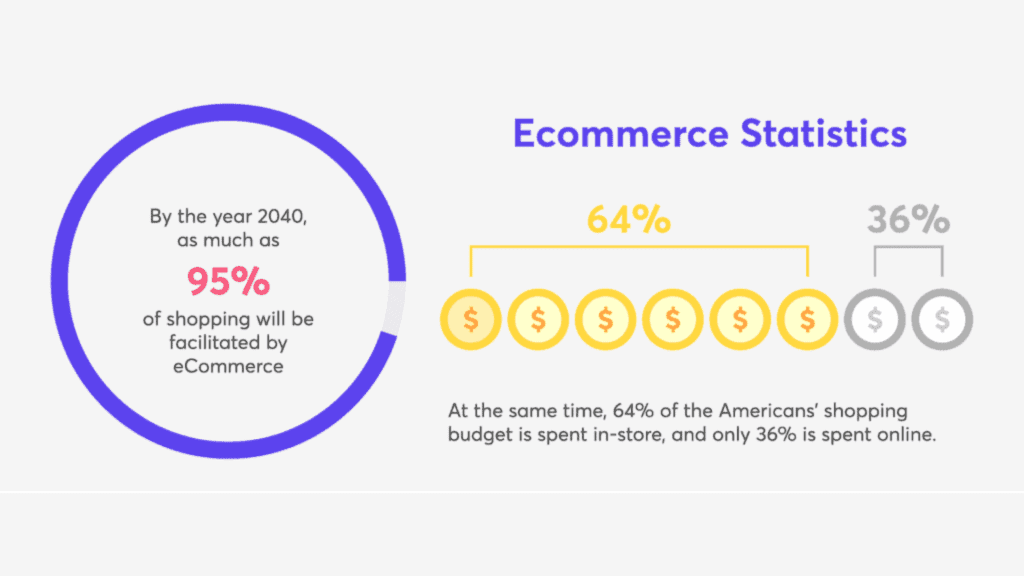
- It is estimated that 95% of purchases will be made online by 2040.
- The eCommerce industry is growing 23% year-over-year.
- More than one-third of American small businesses do not have a website.
- eCommerce is expected to generate USD 5.42 trillion in sales per year.
- It’s estimated that there will be 2.14 billion global digital buyers in 2021.
- On an average, only 1.94% of ecommerce website visits convert into a purchase.
- According to statistics, WooCommerce is the most trusted online shopping platform. Shopify and Wix come after in that exact order.
- Amazon is the biggest eCommerce platform followed by others like eBay, AliExpress, Etsy, etc.
Suggested Read: Selling on platforms like Amazon vs setting up your own online store
Statistics related to revenue, payment, and market share
Unlike the popular opinion, the United States is not the biggest eCommerce market in the world. So, which country is it?
Let’s go through some interesting facts in this section and learn:
- The top ten countries based on eCommerce market share are:
- China: USD 2779 billion
- USA: USD 843 billion
- United Kingdom: USD 169 billion
- Japan: USD 144 billion
- South Korea: USD 126 billion
- Germany: USD 102 billion
- France: USD 80 billion
- India: USD 68 billion
- Canada: USD 44 billion
- Spain: USD 38 billion
- 93.5% of global internet users have purchased products online.
- Globally, 57% of online shoppers buy from overseas retailers.
- Less than 3% of eCommerce website visits convert into a purchase.
- In the US, 41% customers receive 1-2 packages from Amazon per week. The numbers increase when you factor in only young buyers below the age of 35.
- Globally, credit cards are the preferred method of payment, being used in 53% of transactions, followed by digital payment systems (43%), and debit cards (38%).
- Around 50% of people agree that they are likely to purchase something from a website’s chatbot.
Suggested Read:The unlimited benefits of integrating chat feature in your mobile app
Mobile eCommerce Statistics
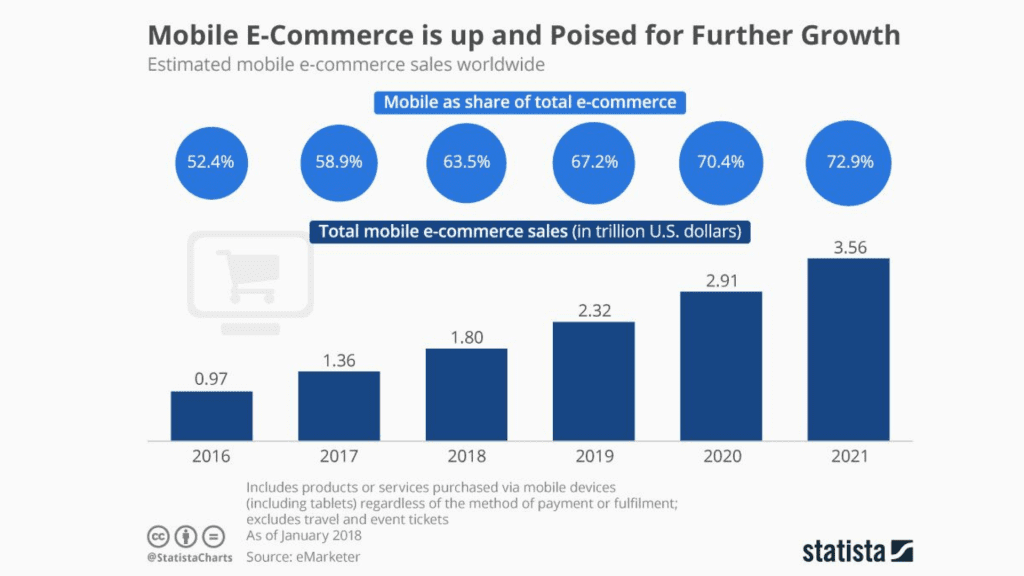
eCommerce cannot even be imagined without mobile in today ‘s day and age. Smartphones and apps have become an indispensable part of our lives.
Consumers want mobile-friendly solutions, thus more and more businesses are turning their WooCommerce sites to apps. Let us discover some mCommerce statistics in this section:
- Mobile apps ensure 3x more conversions than mobile websites.
- 53% of mobile phone users prefer brand specific apps over aggregator platforms like Amazon.
- 82% of netizens in the US have used a mobile device to shop online.
- Mobile ecommerce accounts for 45% of US ecommerce sales.
- Mobile ecommerce sales in the US are projected to grow up to USD 488 billion in 2024.
- 93% of Millennials have compared online deals using a mobile device.
- 40% of all eCommerce sales during the holiday season comes from mobile phones.
- More sales are made on mobile during Black Friday and Cyber Monday.
- 65% of consumers compare price on mobile before buying from a physical store.
- One-third of consumer purchase decisions are influenced by product research on mobile devices.
- 62% of people are more likely to never return to a mobile store after a bad experience.
Suggested Read: 10 statistics that show why you should create an app for your business
Consumer-based eCommerce statistics
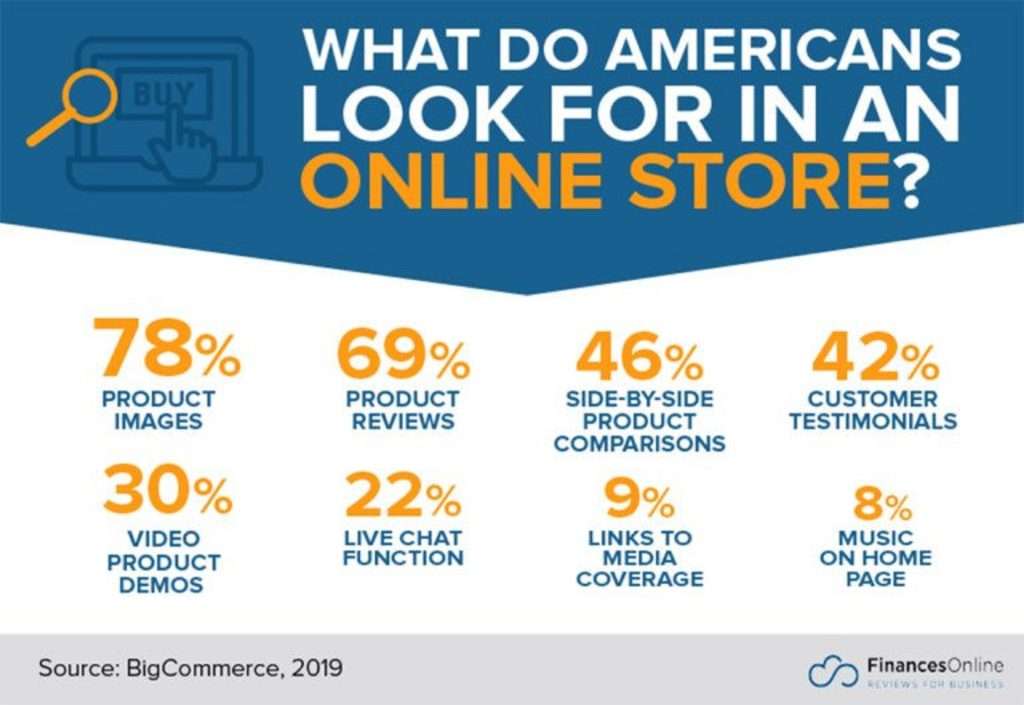
It is the consumers that ultimately shape the fate and success of any industry or business. Let us discover some eCommerce related statistics related to users and their behaviors:
- 67% of millennials and 56% of Gen Xers prefer to shop online. They also spend 50% more time on online shopping.
- 59% of millennials will first go to Amazon when shopping online.
- 38.4% of online shoppers in the US are below the age of 35.
- The biggest group of digital buyers is millennials.
- Less than 14% online buyers in the US are 65 years old and above.
- Though women are stereotyped for being crazy about shopping, men dominate the stats, spending 28% more than women on online shopping.
- 43% of online shoppers have agreed to making purchases while in bed, 23% at the office, and 20% from the bathroom or while in the car.
- Most US shoppers give importance to product images, reviews, video demos & live chat when shopping online.
- 85% of customers start a purchase on one device and finish it on another.
- 81% of buyers trust the advice of friends and family over businesses.
- Most consumers shop online because of 24*7 availability or for free delivery.
- 42% of online shoppers have made a purchase that they regretted, and 21% have accidentally bought something they didn’t want.
- 81% of consumers conduct online research before making an online purchase.
- More than a third of users will buy a product or a service within five days of a Google search.
Suggested Read: Consumer spending on apps is higher than ever! Here’s how you can increase it too
eCommerce statistics related to marketing & branding

Just like any other business, marketing is an integral part of eCommerce. Let us discover some mind-blowing marketing statistics related to eCommerce.
- 61% of consumers prefer brands to contact them via email.
- As per studies, email marketing brings in an ROI (Return on Investment) of USD 42 for each dollar spent.
- 58% of the top 1,000 US online retailers send welcome emails.
- Customized email workflows and segmented email campaigns can drive a 760% increase in revenue.
- Email marketing contributes to 20% of traffic on eCommerce platforms.
- 59% of buyers prefer to buy products from the brands they trust.
- Ecommerce brands in the US are ready to spend USD 200 billion to compete for customer attention.
- 40% of ecommerce brands are investing in their own online communities to earn trust of buyers.
- 61% of online consumers in the United States have made a purchase based on recommendations from a blog.
Suggested Read: Popular mobile app marketing techniques – The complete guide to success
Social media related eCommerce statistics
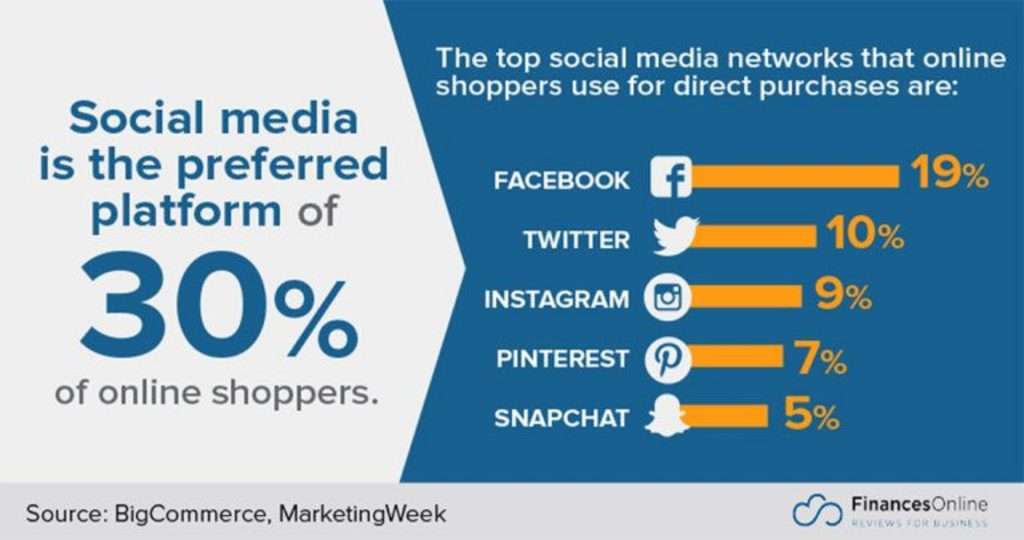
Social media is playing an instrumental role in catalyzing the growth of many businesses across verticals. In fact, social commerce (use of social media to buy & sell goods), has been growing exponentially for years now and continues to get bigger every day.
Let us unravel some statistics related to the same and get more insightful about social commerce:
- Studies show that 25% of US shoppers consult social media before buying a gift for friends and family.
- 74% of consumers rely on their social networks to make purchasing decisions.
- Online stores with a social media presence generate around 40% more sales than brands devoid of that asset.
- US retail social commerce sales is set to rise by 24.9% (up to USD 45.74 billion) in 2022.
- On an average, eCommerce sites publish 4 to 5 posts on their Facebook page every week.
- Facebook is still the most used social media platform in 2022. The other popular ones include Instagram, TikTok, YouTube, Snapchat, Twitter & LinkedIn.
- Some studies show that the average order value for customers coming from Instagram is USD 65, followed by Facebook (USD 55), Twitter (USD 46), and YouTube (USD 38).
- Posts with photos get 53% more Likes, 104% more comments, and 84% higher click-through rates.
- 85% of orders from social media sites come from Facebook.
- 65% of online marketers shared video content on LinkedIn in 2021 which was quite a jump from preceding years.
- 75% of Instagram users have taken an action after looking at an Instagram advertising post.
Suggested Read: Explore the wonders of Facebook marketing for your mobile app
Shopping Cart related eCommerce Statistics
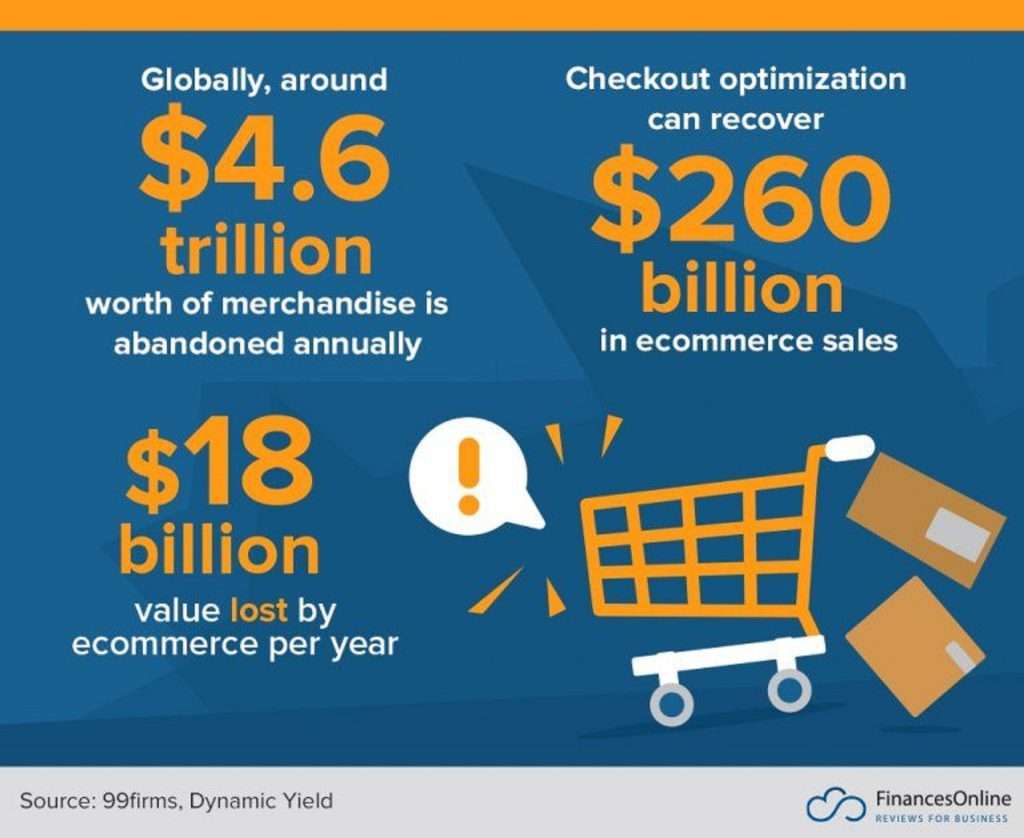
Shopping carts are an indispensable part of eCommerce. Let us checkout some interesting facts and numbers related to carts in this section:
- The average cart abandonment rate for eCommerce stores is around 70 per cent.
- Around 46% of small to mid-sized businesses agree free shipping increases their chance at profits.
- 24% of potential buyers will abandon cart immediately if forced to create account.
- High costs are the biggest reason behind cart abandonments.
- Slow loading sites can increase abandonments by more than 70%.
- Exit intent popups (the one that you often spot when you are about to close a site) can help recover more than 50% of the abandoned carts.
- Abandoned cart emails have an average open rate of 45%.
- Based on industry and niche, clothing (40%), tech (18%), and home décor & maintenance (16%) suffer the highest rate of abandonments.
- The conversions can be increased by 35% if the site offers an optimized checkout design.
Read in Detail: Cart abandonment statistics that every eCommerce business should know of
Overall impact of COVID-19 on the eCommerce industry
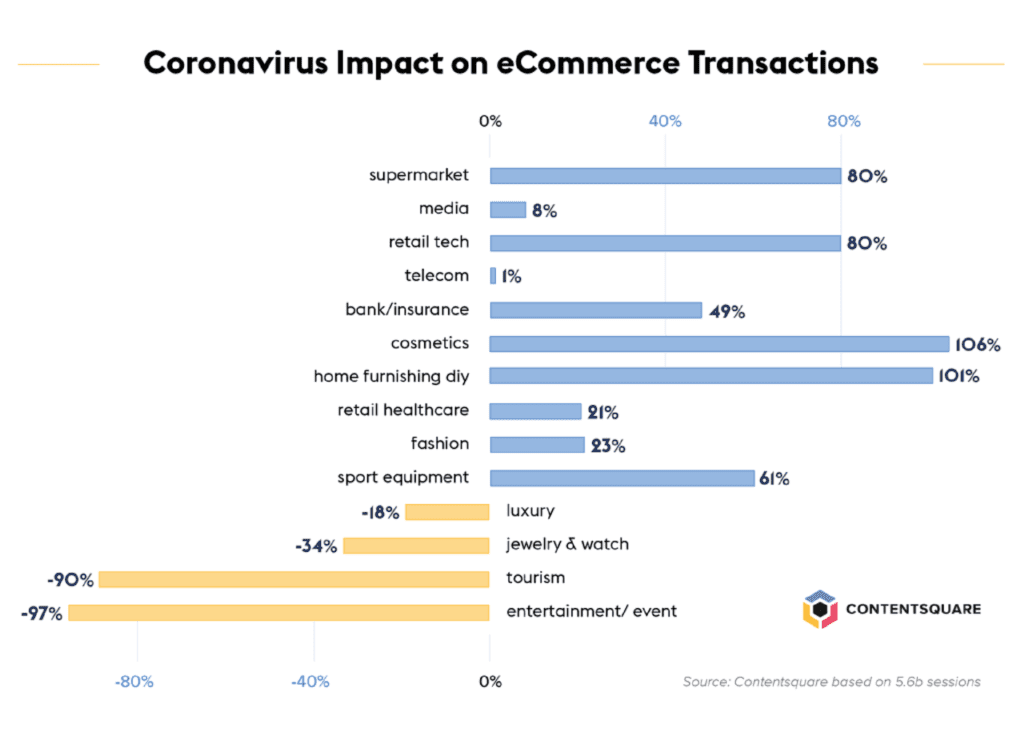
Contrary to the beliefs and the fact that the economy took a hit during the pandemic, the eCommerce industry recorded huge growth as digital was the only way to go for most sellers and buyers.
All the eCommerce projections discussed above, show distinct growth in almost every sector in the coming years. Some stats that summarize the impact are as follows:
- Brazil, Spain, Japan recorded the largest increase in eCommerce businesses as a reaction to the pandemic.
- There was an increase of about 19% in worldwide eCommerce revenue between pre-and-post-COVID time frames in the year 2020.
- Food and Personal Care products recorded the maximum growth (+26%) as compared to other industries like Toys, Hobby & DIY (+21%), Electronics & Media (+19%), Furniture & Appliances (+17%), and Fashion (+14%).
- The share of eCommerce revenue of Small & Medium B2B (Business-to-Business) Companies across the globe also grew distinctively. For Example, US scaled from 17% to 19% in revenue share of small business and recorded a 31% increase in the eCommerce share overall.
- When containments and lockdowns were at peak, the online drug industry registered a growth of 16% in revenue share.
- Before COVID, only seven percent of grocery retail sales were done on eCommerce channels. However, during the peak of the pandemic, the e-commerce share of grocery retail grew to ten percent.
Suggested Read: How to build a grocery app like Walmart?
Wrapping up!
That was all from our end today! The long list of stats can be overwhelming, but it can help you a great deal in understanding the nitty-gritty details of the eCommerce industry.
If you have already entered eCommerce and are looking for a solution to build an app and join the mCommerce industry, then go ahead and check out the free app maker by AppMySite.
Here, you can create a grocery delivery mobile app and give your online business the power and push it needs to scale to new heights of success.
You can also turn to our other blogs and gain wonderful insights related to mobile app development, marketing, WordPress website maintenance, etc. Do not forget to drop your comments in the section below and share your experiences with us. We love hearing from you!
Data and Image Sources:
