


 Products



Mobile apps play a dominant role in every industry, catalyzing growth and expansion for many businesses. The increased need for custom app development and free app maker tools is the biggest testimony to the growing popularity and demand for mobile apps.
When it comes to mobile operating systems, Android and iOS are the two key players that cover almost the entire market. While Android has a far wider reach, iOS is the one that garners the reputation of the most popular one.
Today we are here to compare the market share of the two giants and learn some statistics and facts about them. So, let’s get started without much ado and learn where the two mobile operating systems stand against each other.
Note: In this blog, we have compared Android and iOS from a statistical standpoint. For a generic comparison, you can refer to this article: Android vs iOS users: A detailed behavioral comparison. Else, continue reading and discover Android and iOS facts and statistics.
Android vs iOS market share: An overview
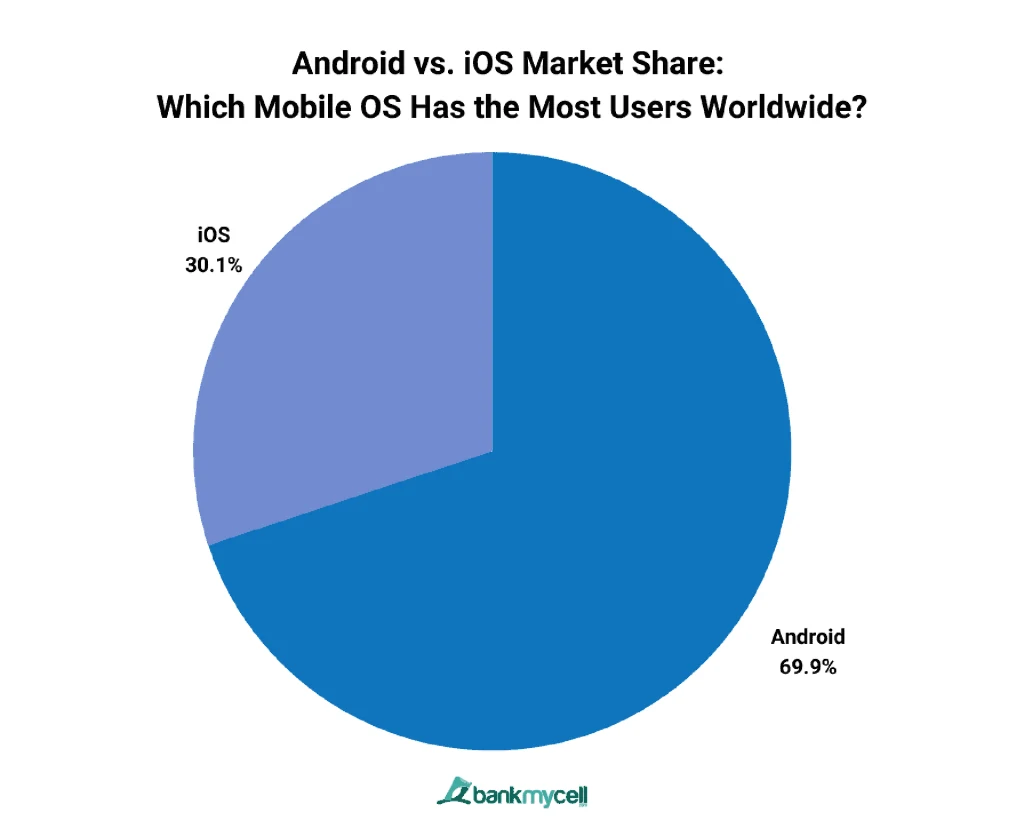
Operating Systems are the lifeline of any device. However, the proliferation of smartphones has made mobile operating systems more popular than desktop operating systems over the years. Google-owned Android and Apple-owned iOS are the two most popular mobile operating systems that are ruling the world.
Android emerges as the global leader here for many reasons. Android comes with more device options, more affordable and flexible infrastructure, and the assurance of Google. These are some of the factors that make it the most popular in almost every country across the world.
However, iOS eats up quite a big share of the industry in more niche markets and first-world countries due to its exclusive appeal. Comparatively, it remains within the reach & feasibility of fewer people due to limited and more expensive options in terms of devices, apps, etc.
Therefore, when we look at the global stats, we find that Android alone covers almost three-fourths of the market (around 70 percent), whereas iOS covers almost the rest of it (around 30 percent). The two operating systems together rule the market, powering 7.21 billion phones with around 5 billion users worldwide.
To give you a little perspective, around ten years ago there were around 2.33 billion smartphones and only 1.01 billion users around the globe. These numbers show that the use of Android and iOS-powered devices has tremendously increased over the years.
Android vs iOS: Key statistics & device-based market share
Operating systems ultimately run upon different kinds of devices like desktops, tablets, mobile phones, etc. Therefore, understanding the popularity of different operating systems across different devices can tell a lot about their hold in the market.
Let us go through some statistics and learn about the same:
Mobile operating system market share
| Android | 70.71% |
| iOS | 28.56% |
| Samsung | 0.37% |
| Unknown | 0.15% |
Android emerges as the unassailable leader when we compare the mobile operating systems in terms of global usage strength. As per the latest reports from Statcounter, Android has a worldwide hold of 70.71 percent whereas iOS holds 28.56 percent share of the global mobile operating system market. Their combined share stands at more than 99 percent of the total market.
The rest of the mobile operating systems like Samsung & KaiOS make up less than 1% of the market share together. This just goes to show that Android and iOS are the two unbeatable mobile operating systems that cannot be competed with.
Tablet operating system market share
| iOS | 54.56% |
| Android | 45.23% |
| Linux | 0.13% |
| Unknown | 0.03% |
The tables turn when we consider the popularity of different operating systems across tablet devices. iOS emerges as the leader here with 54.56 percent as iPads are likely the most popular tablet device in the world.
However, Android manages to give a close contest to iOS here as well. It covers a market share of 45.23 percent for tablet operating systems. Linux, BlackBerry OS, Windows, and others together constitute the rest of the tablet OS market share.
Operating system market share across all devices
| Android | 40.97% |
| Windows | 29.10% |
| iOS | 17.26% |
| OS X | 7.44% |
If we consider the market share of all operating systems across all devices, Android & iOS emerge as powerful here as well. Android accounts for 40.97 percent of the overall market share. Second in the list is Windows with 29.10 percent of the market share, whereas iOS covers 17.26 percent, OS X (macOS) covers 7.44 percent and Linux covers around 1.44 percent of the market.
Evidently, Android & iOS rule the market here as well with a combined share of more than 50 percent. This further underlines the importance of mobile devices and apps and also goes on to show that Android covers a dominant share of the market across all devices.
Region-wise market share of mobile operating systems
In this section, we have covered location-based numbers related to the Android & iOS mobile operating systems. As discussed above, Android is the global leader whereas iOS turns out to have a bigger share in the first world countries. In fact, iOS outshines Android in the USA, UK & Canada, and takes the lead.
Let us look at some more stats related to the location-wise share of mobile operating systems:
| Country | Android Share (in %) | iOS Share (in %) |
|---|---|---|
| Global | 70.71 | 28.56 |
| USA | 41.71 | 57.86 |
| UK | 49.06 | 50.43 |
| Canada | 39.45 | 60 |
| India | 95.12 | 3.99 |
| China | 76.52 | 23.02 |
| Brazil | 81.74 | 18.01 |
As evident above, iOS is more popular in developed countries, however, Android is the primary choice of users across the globe. As Apple devices are quite costly, people prefer buying Android devices over iOS devices despite having a liking for Apple gadgets. Apple’s restrictive and stringent policies also make Android the easy choice for many consumers.
Android vs iOS: User growth statistics
| Number of iPhone users in billion | Number of Android users in billion | Number of iPhone users in billion | Number of Android users in % | Number of iPhone users in % |
|---|---|---|---|---|
| 2024 | 3.9 | 1.46 | 69.88 | 29.39 |
| 2023 | 3.6 | 1.36 | 70.26 | 29.02 |
| 2022 | 3.3 | 1.27 | 71.47 | 27.85 |
| 2021 | 3 | 1.23 | 71.89 | 27.34 |
| 2020 | 2.8 | 1.04 | 73.06 | 26.28 |
| 2019 | 2.5 | 0.95 | 75.47 | 22.71 |
| 2018 | 2.3 | 0.89 | 75.45 | 20.47 |
| 2017 | 2 | 0.81 | 72.63 | 19.65 |
| 2016 | 1.7 | 0.71 | 69.11 | 19.29 |
| 2015 | 1.4 | 0.57 | 64.2 | 20.20 |
Data Source 1, Data Source 2. Data Source 3
Android and iOS are two giants that have eliminated almost every other mobile OS from the picture and have covered almost 100 percent of the market.
There are more than 3.9 billion Android users and more than 1.46 billion iOS users in the world. Around a decade ago, the numbers stood at 1.4 billion users for Android and 0.57 billion users for iOS. This shows a year-on-year growth in the usage of Android and iOS devices. Notably, global smartphone shipments have also increased 7.8 percent year-over-year to 289.4 million units in the first quarter of 2024. This implies that with the growing sale of mobile devices and smartphones, the count of Android and iOS users is also perpetually growing across the world.
Android vs iOS devices: Top vendors and key players
As far as the devices are concerned, it is well known that Apple has its own ecosystem. On the other hand, Android’s “open for all” ecosystem is flooded with all kinds of smartphone devices manufactured by multiple vendors across the globe.
In fact, Android is not a smartphone manufacturer but only an Operating System that relies on other vendors. Whereas iOS is a product of Apple that also manufactures all the devices that its Operating Systems run on.
As far as the Android device vendors are concerned, it is noteworthy that Samsung has been the leader since the very beginning days of Android. Latest statistics show that China-based manufacturers are responsible for over 55 percent of the Android market share. The top players also include Xiaomi, Transsion, and Oppo, among others.
| Samsung | 20.8% |
| Apple | 17.3% |
| Xiaomi | 14.1% |
| Transsion | 9.9% |
| Oppo | 8.7% |
| Others | 29.3% |
Android vs iOS: Top-selling smartphones
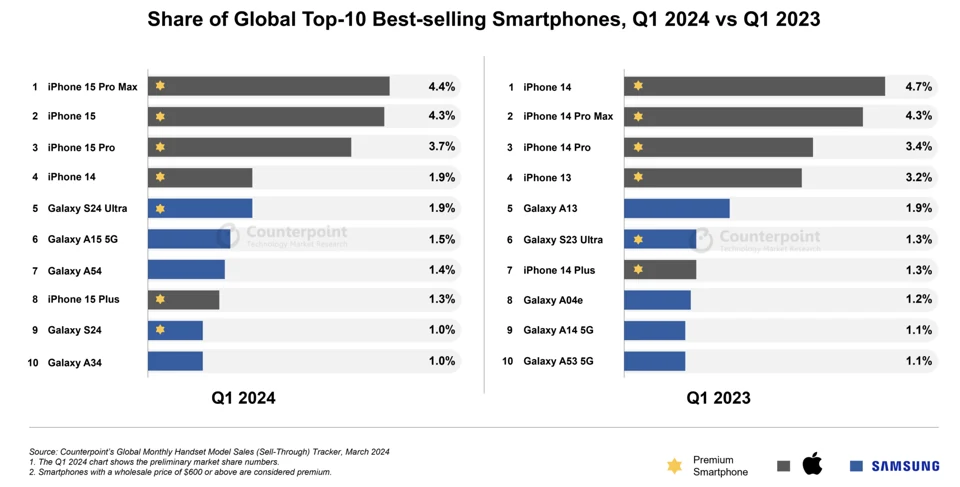
We are aware that Apple has been the largest smartphone manufacturer globally for the longest time. However, as per the latest reports and data, Samsung is giving a close contest to Apple. Samsung recently reclaimed its top spot as the biggest smartphone manufacturer by defeating Apple.
The picture remains somewhat similar when we look at the stats from the device-perspective. Apple and Samsung predominantly are the first choice of smartphone buyers across the globe.
In fact, Apple’s iPhones and Samsung’s Galaxy devices take up the largest share in the list of best-selling smartphones. Customers across the globe prefer buying the latest iPhones and Samsung Galaxy smartphones.
Android vs iOS revenue statistics: Who earns more?
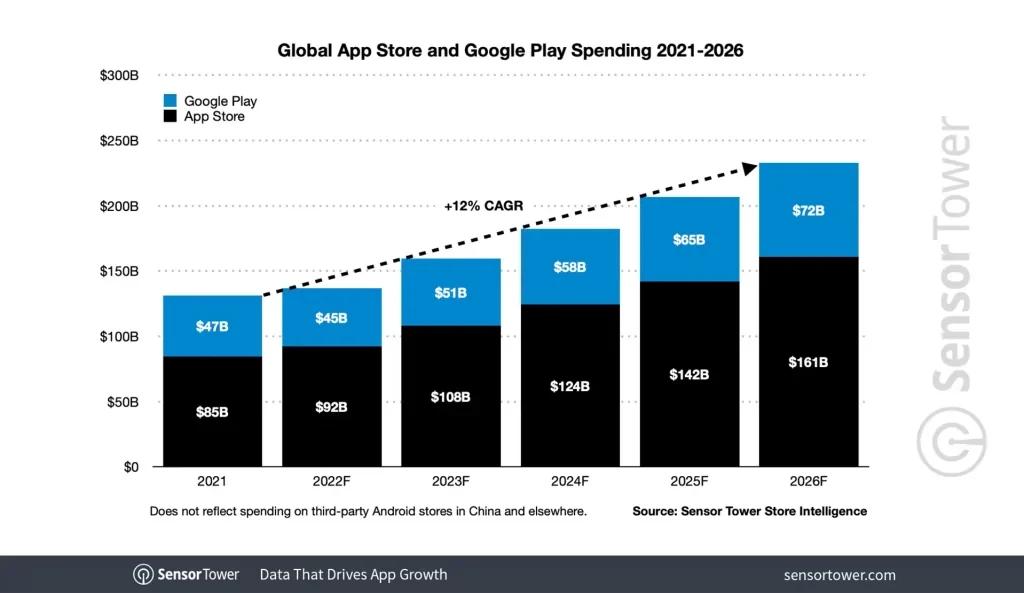
This fact may seem odd to some, but despite Android having the larger share of the global market, iOS apps bring in more revenue through paid apps, in-app purchases, and other app-based sales via Apple App Store.
This is likely because iPhone users are ready to spend more on their apps. As per statistics, Android and iOS app revenue (total consumer spending on mobile apps) in the year 2022 was around 167 billion US dollars. It is noteworthy that while Android contributed 27 percent, iOS was responsible for more than half of the total revenue, despite having far less share in the market in terms of usage.
Additionally, studies and forecasts show that consumer spending on the Apple App Store is set to reach 161 billion US dollars by the year 2026. Comparatively, consumers are likely to spend 72 billion US dollars on the Google Play Store.
Therefore, if you want to make money with your apps, then targeting the iOS ecosystem may be a better choice than Android. You can check our blog on consumer spending and learn some more statistics related to Android and iOS apps and the revenue made by the Google Play Store and Apple App Store.
Additionally, to gain some perspective, you can also go through the list of top apps on the Google Play and Apple App Store across all categories. Notably, gaming apps remain a popular choice across both app marketplaces.
| Country: US | Google Play Store | Apple App Store | ||
|---|---|---|---|---|
| Rank | App | Category | App | Category |
| 1 | Google One | Productivity | TikTok | Entertainment |
| 2 | MONOPOLY GO! | Games > Board | YouTube: Watch, Listen, Stream | Photo & Video |
| 3 | TikTok | Social | MONOPOLY GO! | Games |
| 4 | Pokémon GO | Games > Adventure | Royal Match | Games |
| 5 | Royal Match | Games > Puzzle | Roblox | Games |
| 6 | Candy Crush Saga | Games > Casual | Max: Stream HBO, TV, & Movies | Entertainment |
| 7 | Max: Stream HBO, TV, & Movies | Entertainment | Tinder Dating App: Chat & Date | Lifestyle |
| 8 | Amazon Shopping | Shopping | Disney+ | Entertainment |
| 9 | Roblox | Games > Adventure | Candy Crush Saga | Games |
| 10 | Last War: Survival Game | Games > Strategy | Audible: Audio Entertainment | Books |
(Note: Data subject to change as per latest updates)
Data Source
Wrapping up!
That was all about the market share of the two most popular mobile operating systems, Android and iOS. It goes without saying that both are significant and popular in their own way. While Android enjoys mass popularity, iOS has built quite a niche market for itself.
Android wins the title of the platform for most apps, but iOS attracts and earns more revenue. This picture may or may not change in the coming time, but it remains as it is for now. We recommend that you create apps for both mobile operating systems to ensure maximum coverage.
If you are interested in more such market share and statistical reads, then do not forget to check out the other blogs that we have published and get a detailed knowledge of various topics like WooCommerce vs Shopify, WordPress vs Wix, WordPress market share, WooCommerce market share, Shopify market share, and more.
You can also drop comments and let us know if you want to read other related comparison and market share blogs. We would be happy to cover them for you. Also, while you are at it, do not forget to checkout AppMySite’s Android app builder and iPhone app maker and create your own applications for free.