The fight for supremacy between Android and iOS has been existent since years. It is only reasonable to vouch for both as each of the two has its own unique characteristics and benefits.
However, what is important, is for businesses to understand their potential users’ behaviors before they create an app online and launch it on the app stores.
Having an idea of the standard behavior and preferences of your Android and iOS users can open doors to many opportunities.
You can identify which group is most suitable for your business goals and what are the best strategies and mediums to approach them. It can also make you capable of addressing the specific needs of your target audiences.
Today, we are here to help you with the same. So, let’s get started and learn how Android and iOS users differ from each other and what impact the differences can have on your business.
In this blog
- Android vs iOS users: An overview of the market share
- User switch: Android to iOS and vice-versa
- Differences influenced by Apple & Google’s policies
- Role of demography in shaping user behavior
- Android vs iOS: User-acquisition cost and spending
- Retention & engagement trends among Android & iOS users
Android vs iOS users: An overview of the market share
Android and iOS together make-up for more than 97 percent of the mobile operating system market share globally.
In fact, Android was once again the leading mobile operating system worldwide in January 2022, controlling the market with a share of around 70 percent, while iOS accounted for a share of around 25 percent.
These two are the primitive platforms that every mCommerce business aims for. However, they differ highly in terms of infrastructure, features, technology, etc., thereby attracting varied kinds of audiences and inspiring different kinds of behavior in them.
Let us introduce you to some more fascinating facts and numbers that will give an overview of the differences between the Android and iOS operating systems and their respective users.
- Android is the leading OS (operating system) across all devices with a market share of around 41 percent. This is followed by Windows at 31.5 percent and iOS at around 17 percent.
- Android has over 2.8 billion active users and a global market share of more than 70 percent when it comes to mobile OS.
- iOS ranks second in mobile OS market share at somewhere around 29 percent with more than 1.65 billion users across the globe.
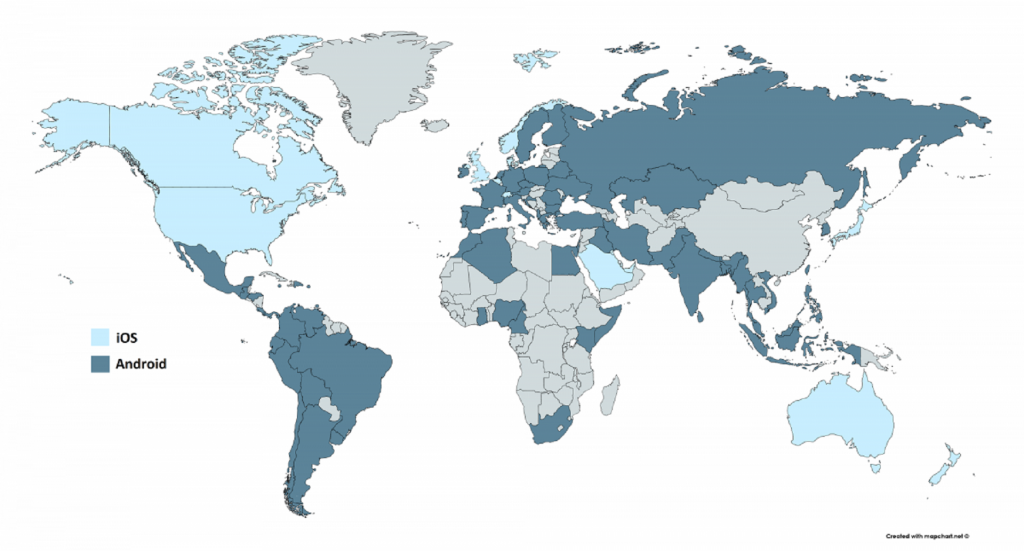
- iOS gives Android quite a run for popularity in first world regions like USA and UK. However, Android holds over 85 percent market share in countries like Brazil, India, Indonesia, Turkey, and Vietnam.
- On average, iPhone users engage with their smartphone apps for nine more hours in a given month than Android users.
- iPhone users are willing to spend more than Android users for in-app purchases and other services and products.
- iOS users are around 10 percent less likely to open a push notification on their device as compared to Android users.
These are only some of the stats. As we continue, you will learn more about the purchase and spending behavior of Android and iOS users.
However, the stats give a fair idea about the basic user distribution between Android and iOS platforms, their demography and more.
While iOS has a niche market that relies heavily on Apple’s brand name, Android is more popular and widely used by people belonging to all kinds of social and economic groups.
Suggested Read: The best strategy to reserve a name for your Android and iOS apps
User switch: Android to iOS and vice-versa
Before we get into other details, let us tell you about the switching tendencies of Android and iOS users.
It is true that there is a great number of Android users who are bowled by the charm and hype of Apple devices and would buy one if they have the resources.
However, this may come as a shocker that there are quite a number of iOS users too who would ardently make a shift to Android.
Let us validate this with some statistics.
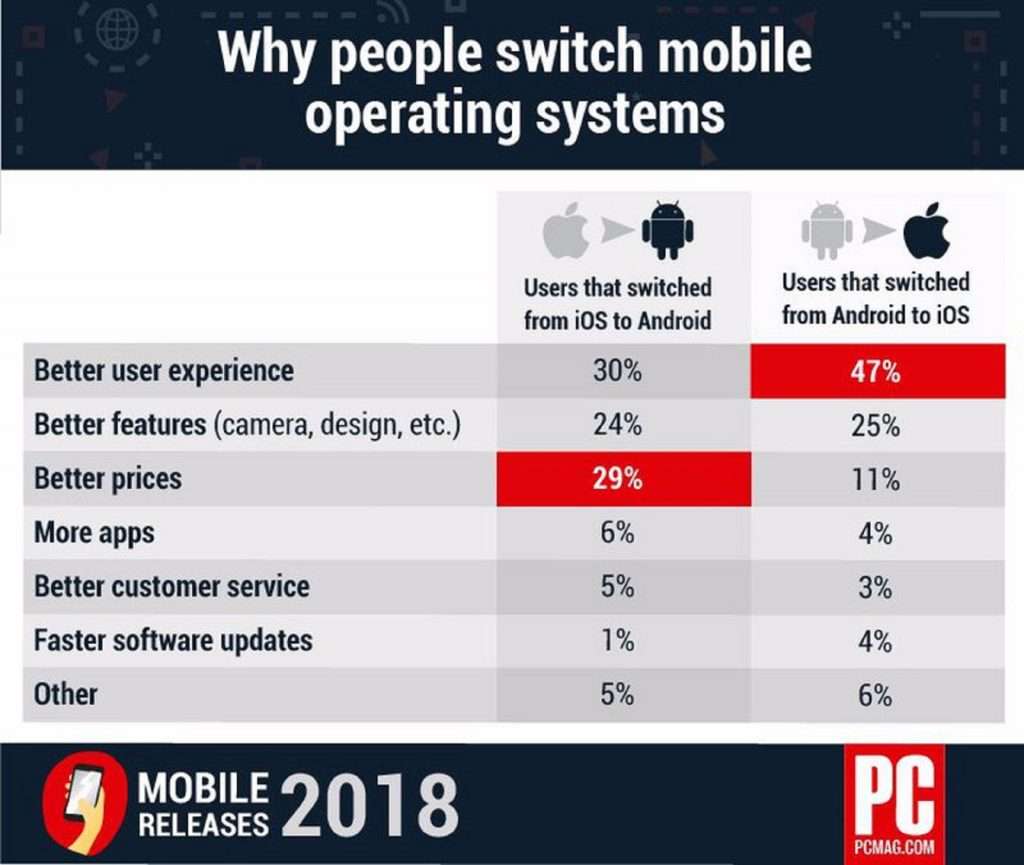
Interestingly, Apple itself admitted that 26 percent of iPhone users moved to Android in 2020. While it claims it is not concerned about the switch, the stats are still alarming.
SellCell, a smartphone price comparison and reselling platform, recently conducted a survey with 5,000 Android users in the United States.
The survey found that 18.3 percent of Android users would consider switching to an iPhone 13. This was a significant decline from last year when 33.1 percent of Android users wanted to switch to an iPhone, showing a drop of around 15 percent.
31.9 percent of Android users ticked iPhone 13’s lack of a fingerprint scanner as the reason behind not switching to iPhone. 16.7 percent named iOS’s limited customization and 12.8 percent pointed to iOS’s lack of support for side loading apps as the main reasons for not switching.
Clearly, it is not all gold and glitter for the iOS industry too. However, what remains constant is that both Android and iOS users are smart enough to take strategic decisions use the services and benefits accordingly.
We will discover Android vs iOS user loyalty in detail in the sections below.
Suggested Read: The complete guide to iPhone screen resolutions and sizes
Differences influenced by Apple & Google’s policies
Apple App store and Google Play Store are the two biggest app marketplaces selling iOS and Android apps respectively.
The two play a decisive role in how the apps placed on their platforms shape up and function and have clear policies for the same. This often leads to a considerable influence on how the Android and iOS users respond to the apps on their devices.
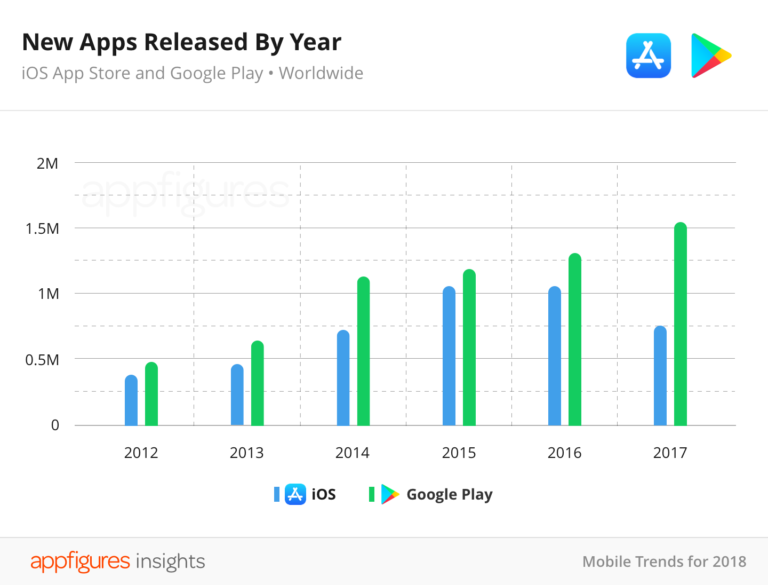
For instance, Apple is far more stringent than Google when it comes to app submissions and clearances. Thus, an iOS app is more likely to face rejection as compared to an Android app. This is probably why there are more apps on Google Play Store than Apple App Store.
Additionally, the security and privacy policies and restrictions are also denser on Apple as compared to Google. As a result, Android users can be reached more easily through push notifications and personalized advertisement and marketing content.
While this also increases the competition, it makes Android a better choice than iOS if you want to send messages and notifications to your users more freely.
Additionally, Google powered Android devices are more customizable than Apple powered iOS devices, thereby making it more lucrative for those looking for absolute control.
Suggested Read: How does App Store Optimization differ for Google Play and Apple App Store?
Role of demography in shaping user behavior
As discussed earlier, Android users outnumber iOS users, and are scattered all over the world.
However, Android is more popular in developing countries and low to mid income areas. On the other hand, iOS has a bigger market in developed countries and among the high-income groups.
Let us understand how demography influences the behavior and decision-making tendencies of Android and iOS users based on various parameters:
Gender based differences
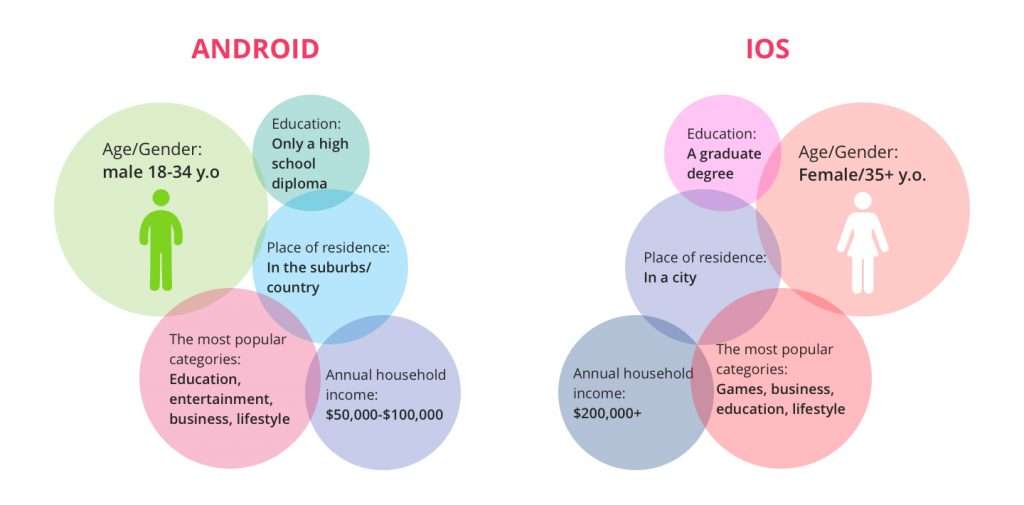
It may also not come as a surprise that men are more likely to own an iPhone as compared to women.
However, as per a survey conducted by the Mobile Ecosystem Forum, 51 percent respondents that were Apple smartphone users, identified as female. So, the number could be erratic and may vary highly in different countries.
Women are also more likely to make in-app purchases than men. In fact, as per a 2018 report by Liftoff, the in-app purchase conversion rates for women were 26 percent higher than for men.
Income & living based differences
Studies show that on an average, iPhone app users earn something between USD 50,000 to USD 85,000 per year. On the other hand, Android users have an average income between USD 35,000 to USD 60,000 on an average.
The numbers go way higher when annual household income is considered. As education often affects income and living, one may also see trends that indicate the popularity of iOS over Android among those with higher degrees and those living in more urbanized areas.
However, this is a very general overview and things may differ under different circumstances on a more granular level.
Suggested Read: Top 45+ Mobile app marketing and advertising statistics – How do companies sell apps?
Android vs iOS: User-acquisition cost and spending
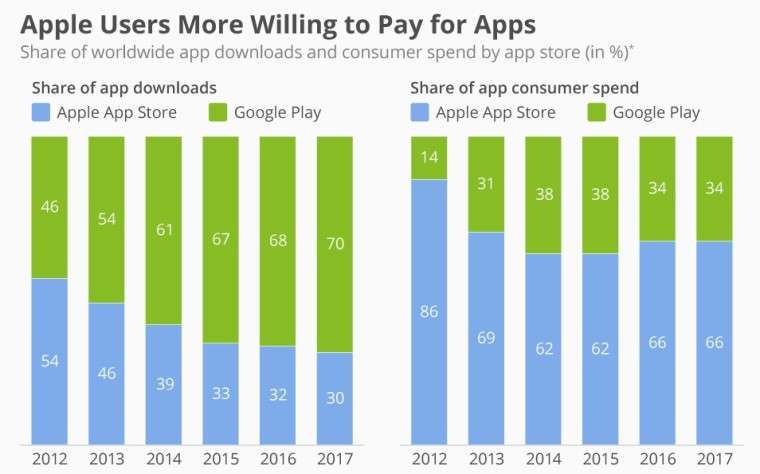
It is true that there are more Android apps than iOS apps in the world and more Android apps are being downloaded by users every minute. However, this trend is not emulated when it comes to the revenue and earning through apps.
Let us understand this with some statistics:
- In the year 2021, the total revenue through Android and iOS apps reached USD 133 billion. This was a 19 percent increase from the previous year.
- iOS apps were alone responsible for 63 percent of the revenue in 2021, as listed above.
- App users made 67 percent of their total spending towards gaming apps in 2021. Google Play contributed USD 37.3 billion, or about 41 percent in the total revenue made through games.
- iOS accounted for 76 percent of the USD 32.1 billion revenue created in 2020 outside of games. Android users spent USD 6.7 billion and iOS users spent USD 24.7 billion on apps other than gaming.
- Revenue made through subscriptions increased to USD 13 billion in 2020 and iOS alone was responsible for 79 percent of the revenue.
- The cost-per-install on iOS is 60.4 percent (USD 5.31) more than Android (USD 3.31).
- Android apps earn revenue mainly from mobile advertising while iOS generates most of its revenue from in app purchases.
As evident from the stats above, iOS users spend more as compared to Android users. However, the trend is changing steadily as Android users have also started entrusting apps with their money.
As per Liftoff, it happened for the first time in 2017 that the industry started to see high-grossing games that made the same amount of IAP (in-app-purchase) revenue on both platforms.
This clearly signifies that Android users are willing to spend but they just need to be targeted in the right way.
Additionally, the lower revenue through Android does not hurt as much because the cost of user-acquisition is also low for Android users.
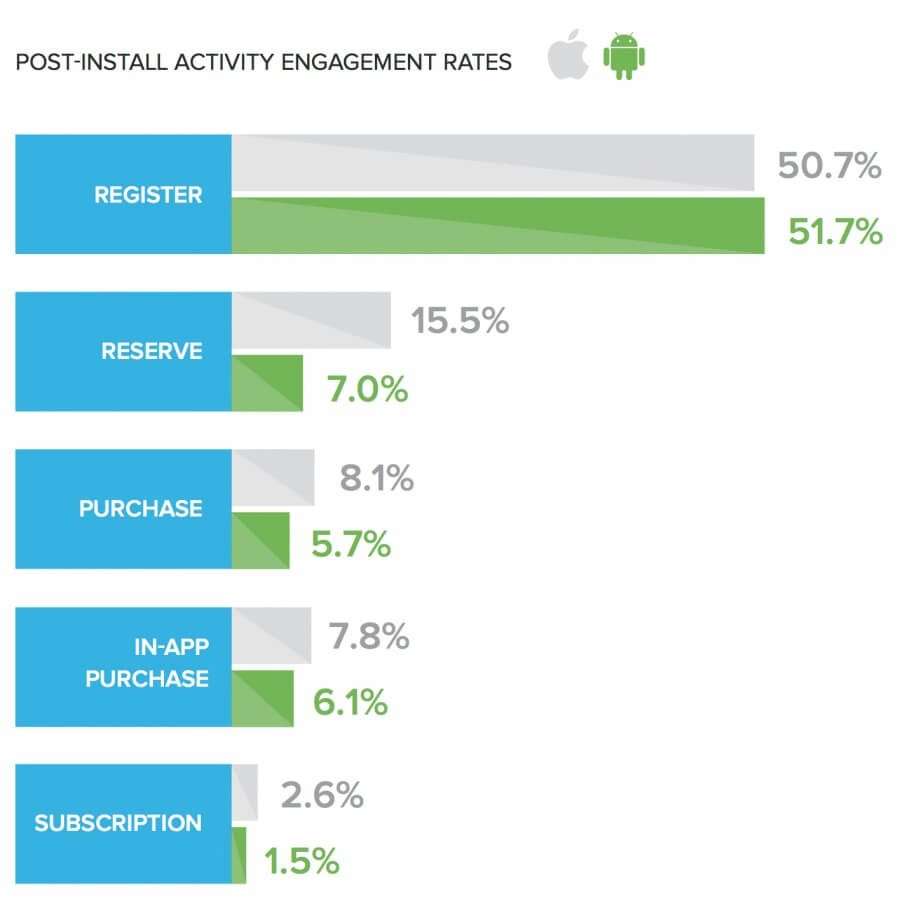
As per the report discussed above, acquisition of Android users only costs around USD 6.37. An impressive install-to-register rate of 52 percent (8.4 percent more than iOS) adds even more value to this target group.
Additionally, while iOS users are more eager to make payments and purchases, their registration rate is lower than that of Android users. However, iOS users spend more on clothing, cosmetics and even tech products as compared to Android users.
Android users give more preference to apps belonging to the utility, performance, media, productivity, and other similar categories. They will spend more than iOS users on apps belonging to these categories.
Clearly, Android users spend less than iOS users, however they are a better target audience for revenue through in-app advertisements.
Suggested Read: Retention vs Acquisition – Where should app startups focus their efforts?
Retention & engagement trends among Android & iOS users
User retention and engagement play a major role in the success of any app. In this section, we will explore the same avenue and compare it for Android and iOS users.
As discussed above, iOS users spend more than Android users but are costlier to acquire. However, when we look at the loyalty trends, Android and iOS users are at par with each other.
However, as iOS apps users have fewer options as compared to Android users, they are more likely to be loyal and not look for alternates as frequently.
iOS users also spend more hours as compared to Android, so it may be easier to retain them. iOS users spend 45.2 sessions on average in a week whereas Android users spend 43.5 sessions. Additionally, iOS users may also spend more on apps and thus their cart-abandonment rates might be lower than Android users.
However, when it comes to engagement through push notifications, Android takes a lead over iOS even though iOS users are more likely to open a notification faster than Android users.
Statistically speaking, iOS push notifications may have an average open rate of 3.28 percent and conversion rate of 0.7 percent. On the other hand, Android notifications have an open rate of 4.57 percent and a conversion rate of 1.8 percent.
Talking about in-app messages and prompts, iOS has an open rate of 9.9 percent, compared to Android’s 7.26 percent. The conversion rate for these messages stands at 3.83 percent for iOS and 3.35 percent for Android.
However, we must remember that Android is a better platform if you earn engagement and revenue through ads. Therefore, we can say that both the platforms have a great number of audiences that is unique, and they enjoy considerable loyalty.
Suggested Read: Discover the advantages of Retention Marketing for eCommerce and make the most of it
In conclusion
Android and iOS users are both essentially the same but differ somewhat in their preferences and browsing and shopping behavior. Therefore, you must keep it at the core of your business decisions when you are aiming to target them.
As discussed above, you can go with iOS if you are looking for more in-app purchases and with Android if you want to target a broader audience.
However, we suggest that you make the most of both worlds. Why not target both Android & iOS users when you can publish apps for both on an optimal budget? Aim for both Android and iPhone app development and target a wider market.
You can sign up for AppMySite’s app maker for free and build premium feature rich apps. Try it to believe it!
Also, do not forget to explore our other blogs and drop your feedback in the comment section below. We love hearing from you!
Data & Image Sources
- AndroidCentral
- MacRumors
- IndiaTimes
- 9to5Mac
- StatCounter
- InMobi
- Netrix
- Comscore
- MarketingDive
- SellCell
- Hubspot
- Forbes
- Appdev360
- DeviceAtlas
- BusinessofApps
- Neowin
- UplandSoftware